Thousands of scenarios. One defensible estimate. Integrated probabilistic cost and schedule risk analysis for highway construction, built on NHI 134205 principles.
Identify risks, quantify their impact, and measure the value of your risk response program
Already licensed? Renew upgrade coverage →
CASTR automates the NHI Course 134205 methodology, bringing rigorous probabilistic analysis to every project team.
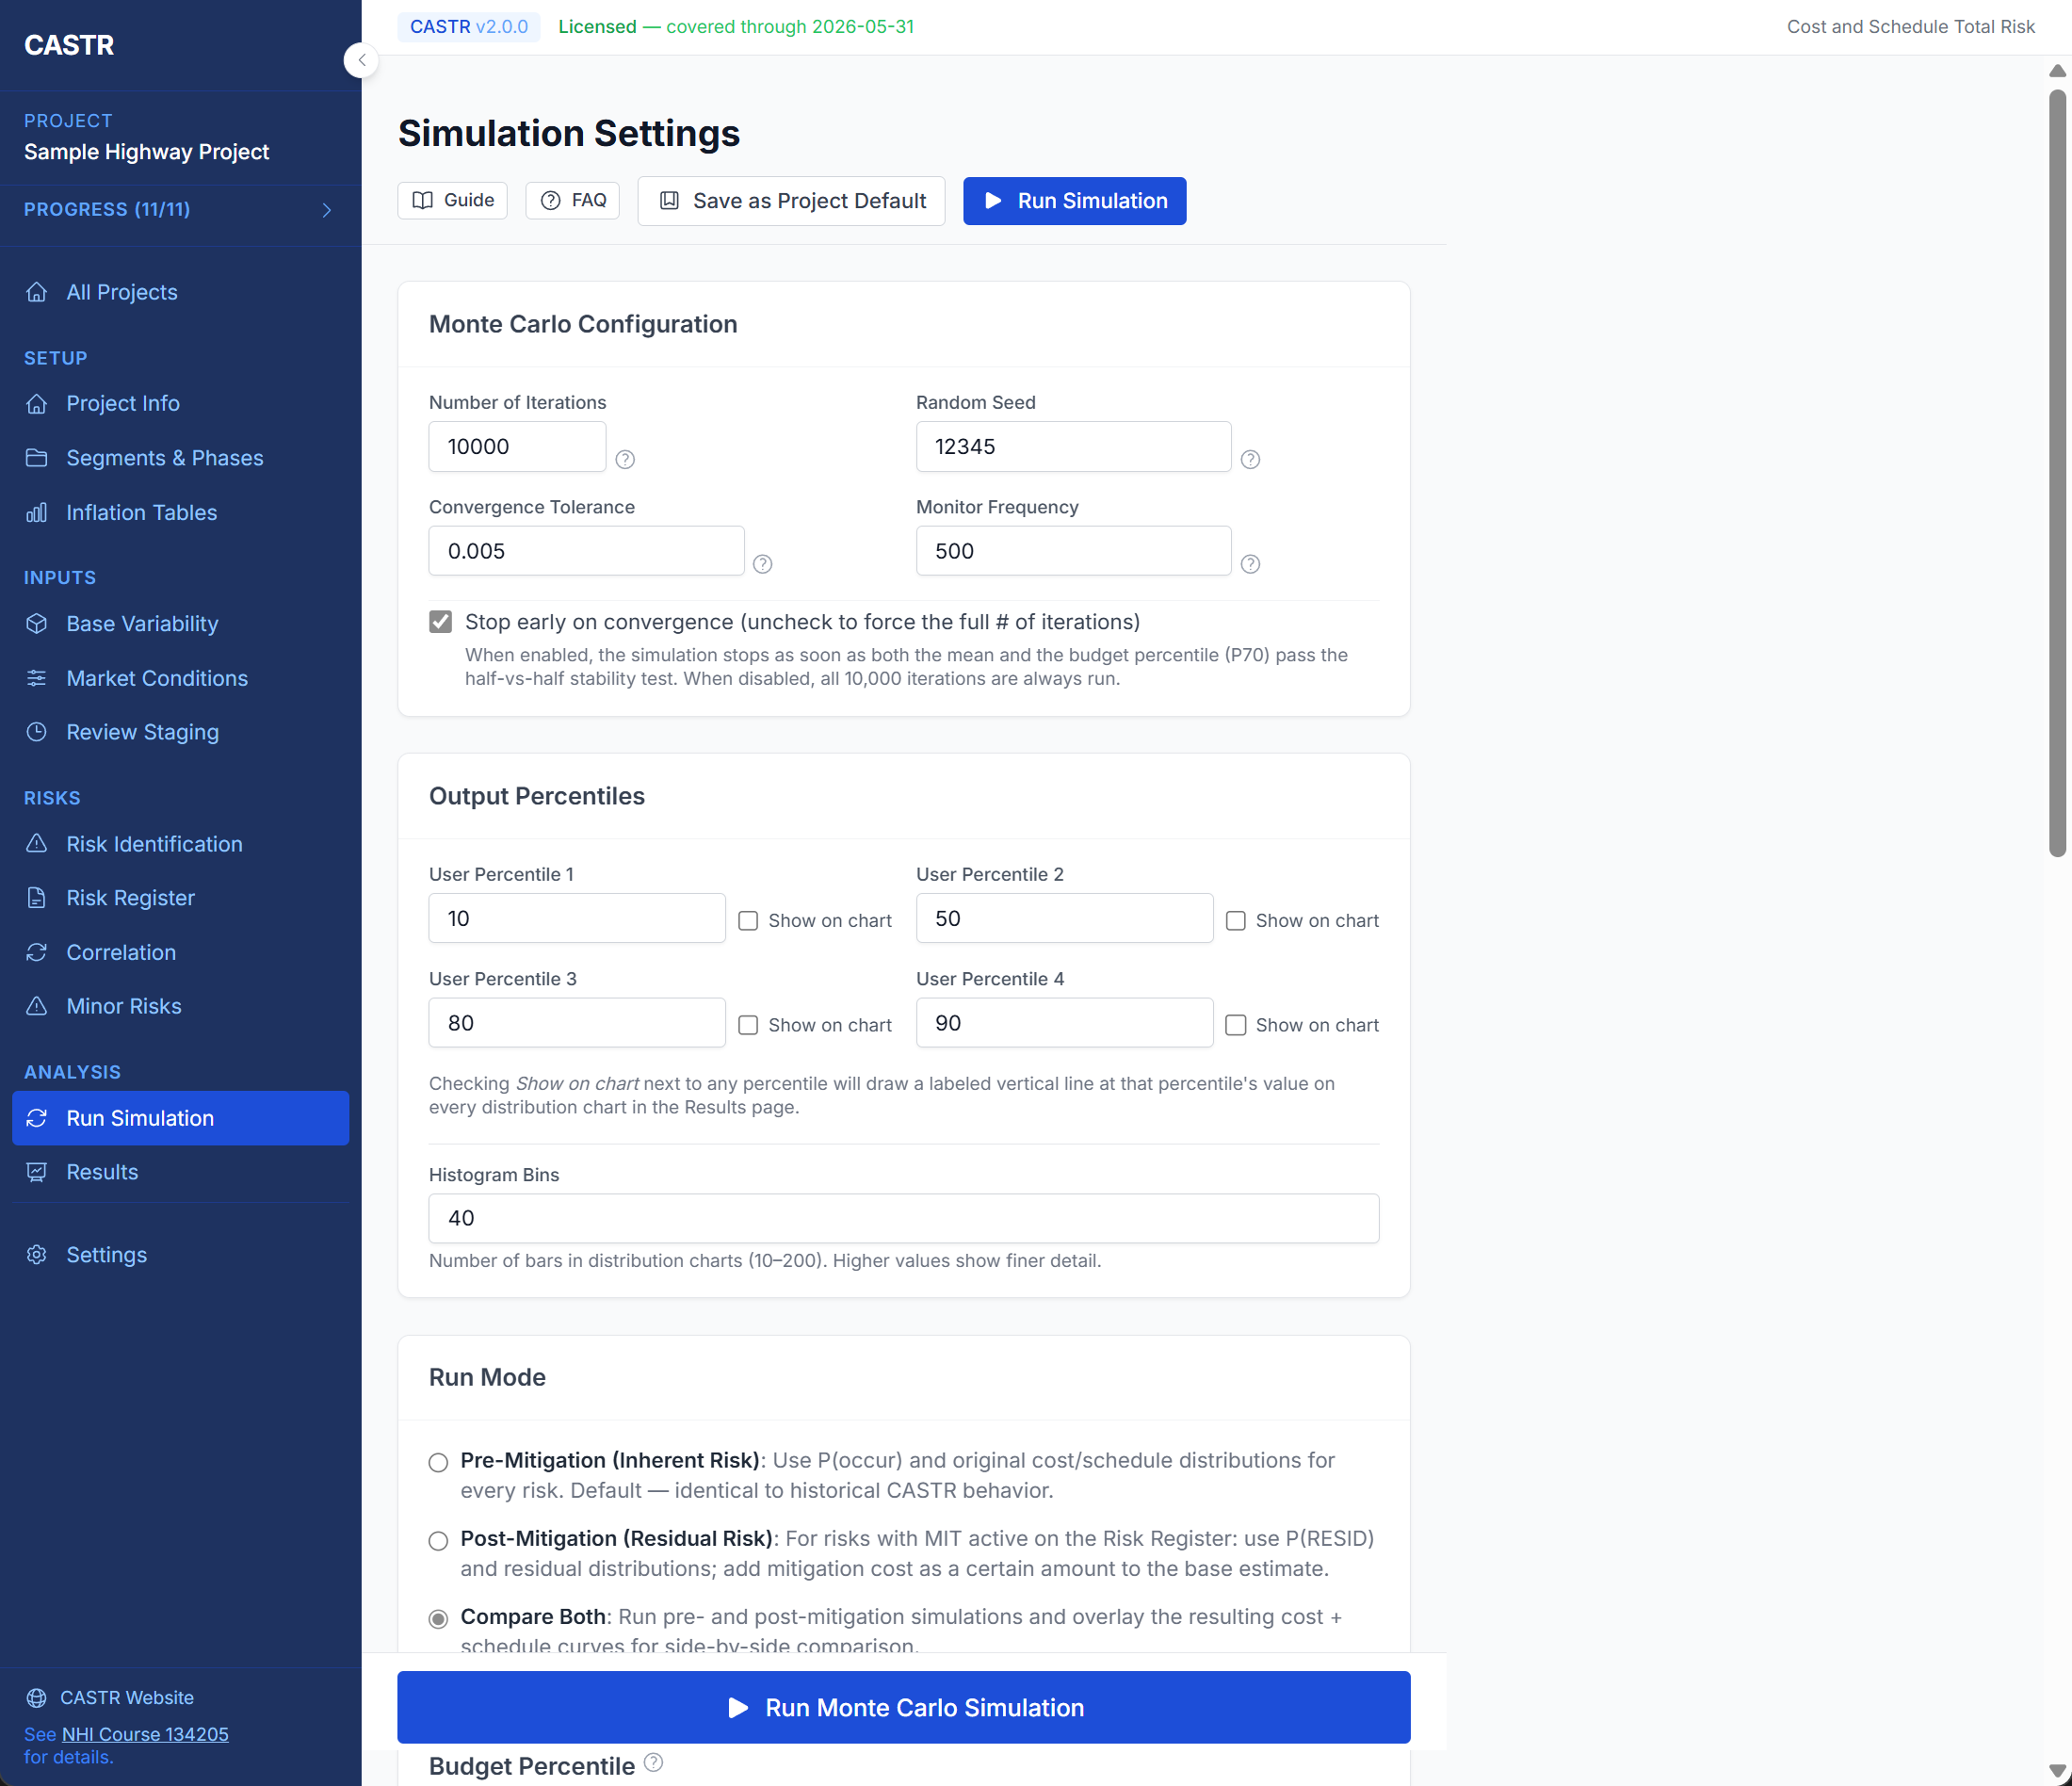
Run 100 to 100,000 iterations with convergence-based early termination, reproducible seed control, and half-vs-half stability testing on mean and budget percentile.
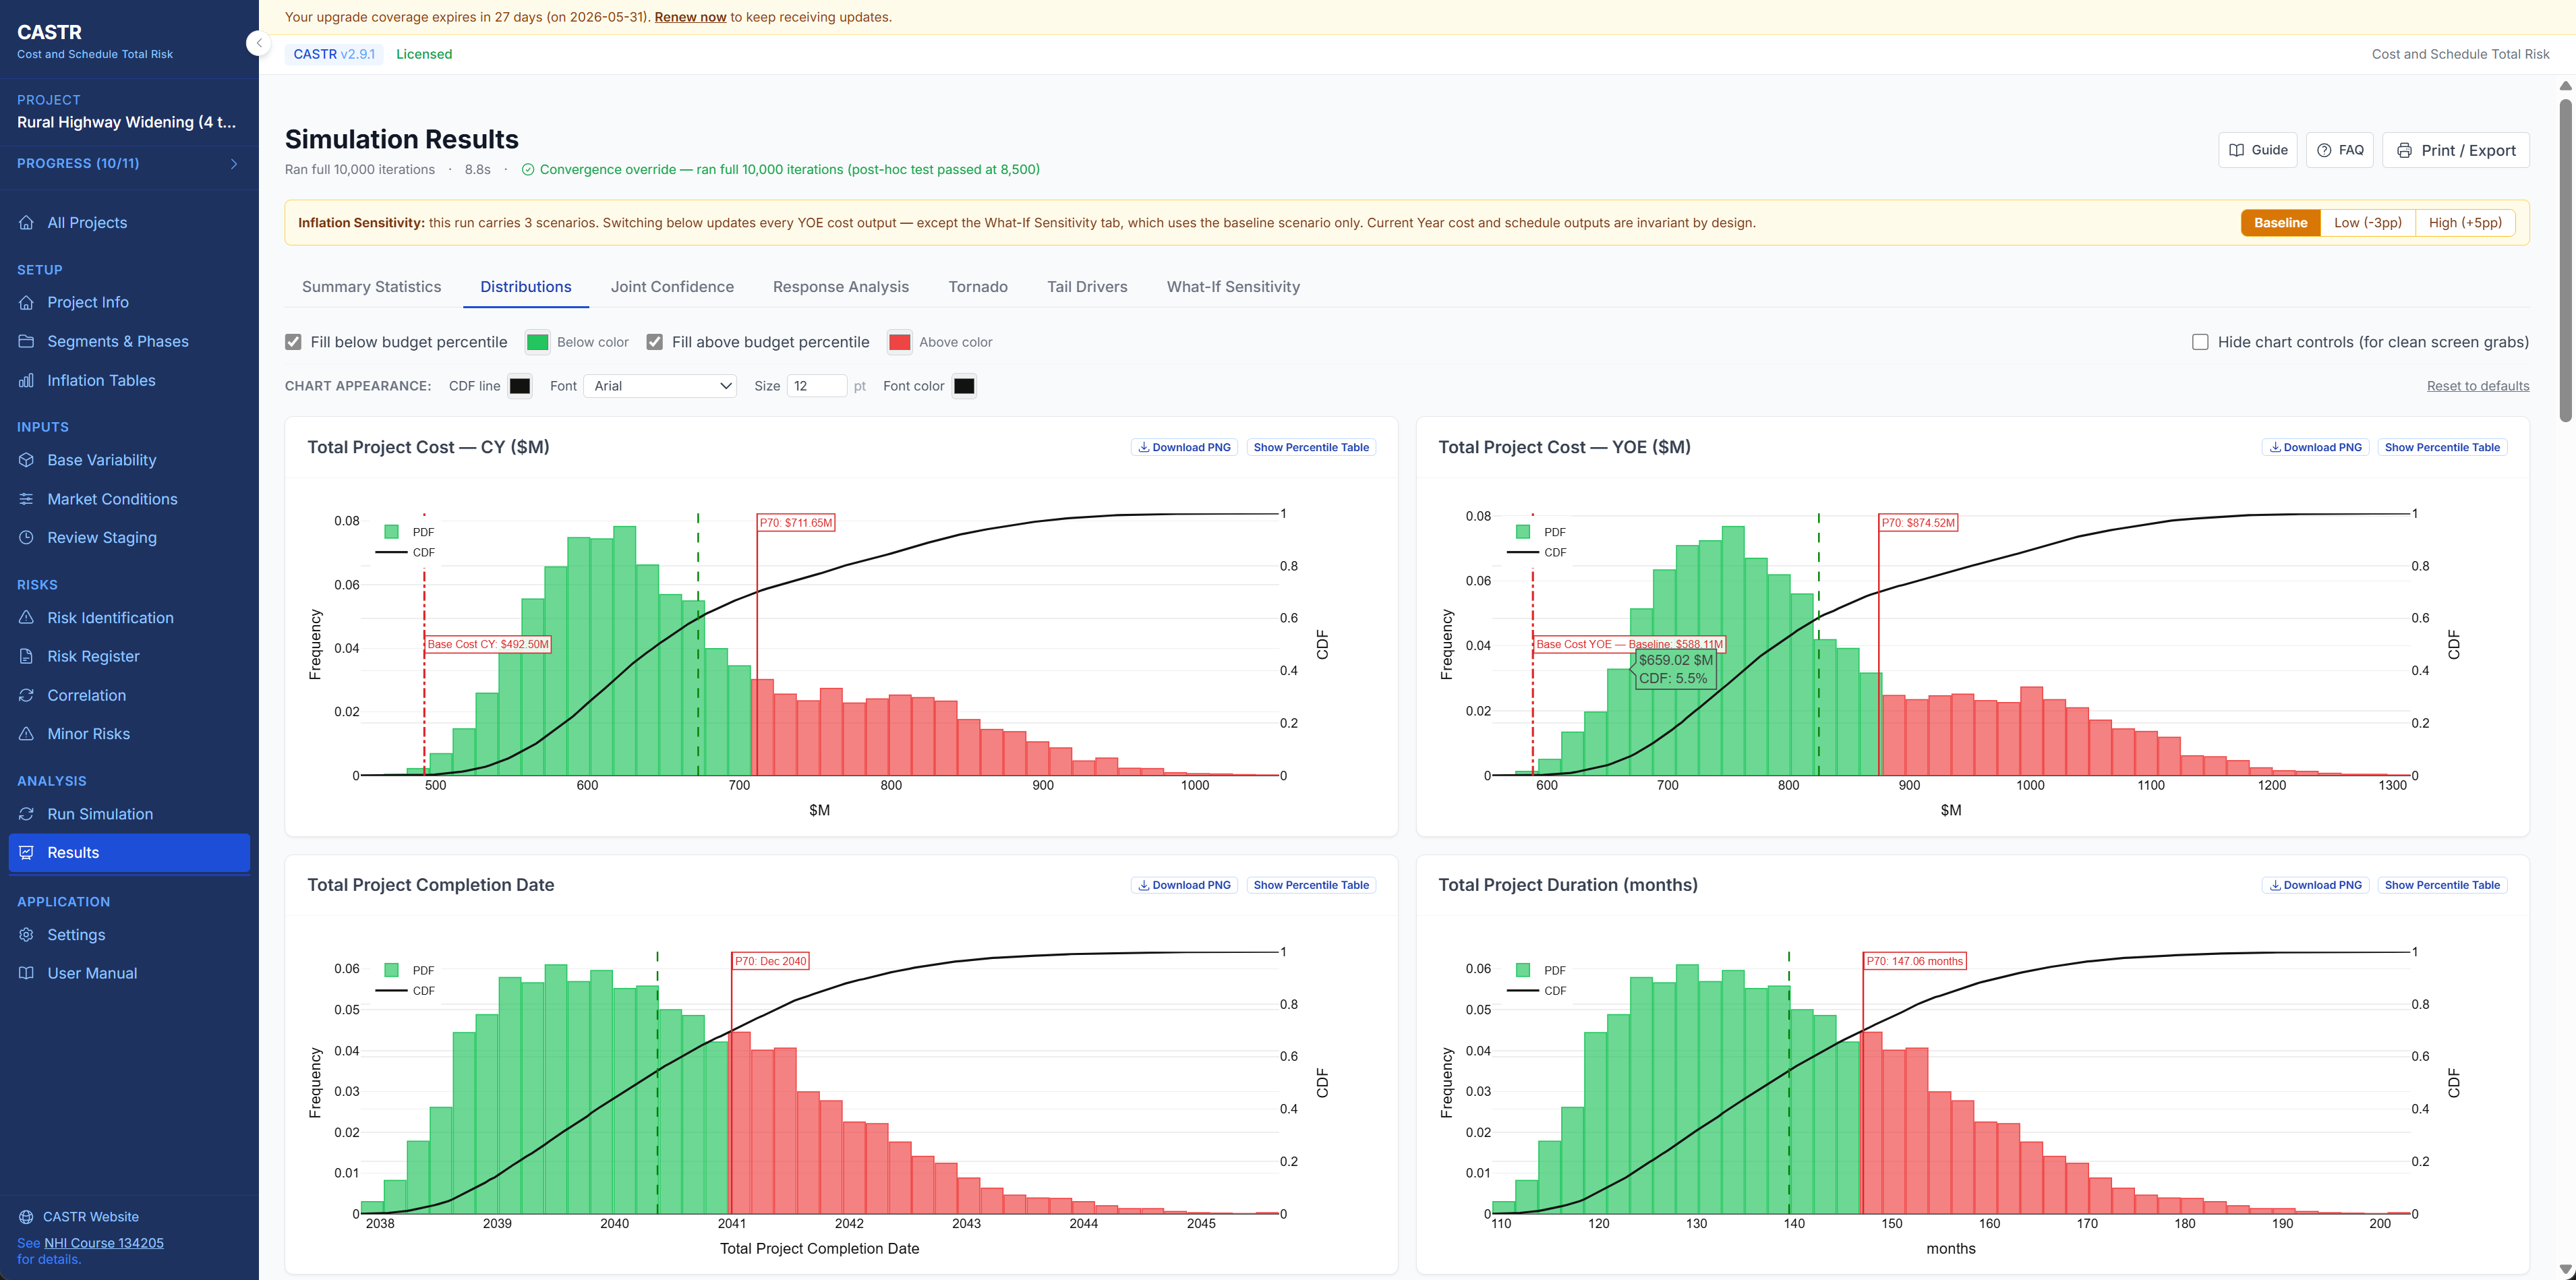
Interactive histogram + CDF overlay for total cost (CY and YOE), duration, and project completion date. Configurable bin counts, labeled percentile lines, dynamic bar coloring around the budget cutoff, and 300 DPI PNG download.
Spearman rank correlation tornado charts with “% var” variance share annotation on every Risk Register row. Risk Impact mode shows bar range, mode, and EV markers. Toggle Sort: EV vs. Sort: Variance Share across cost CY, cost YOE, and schedule views.
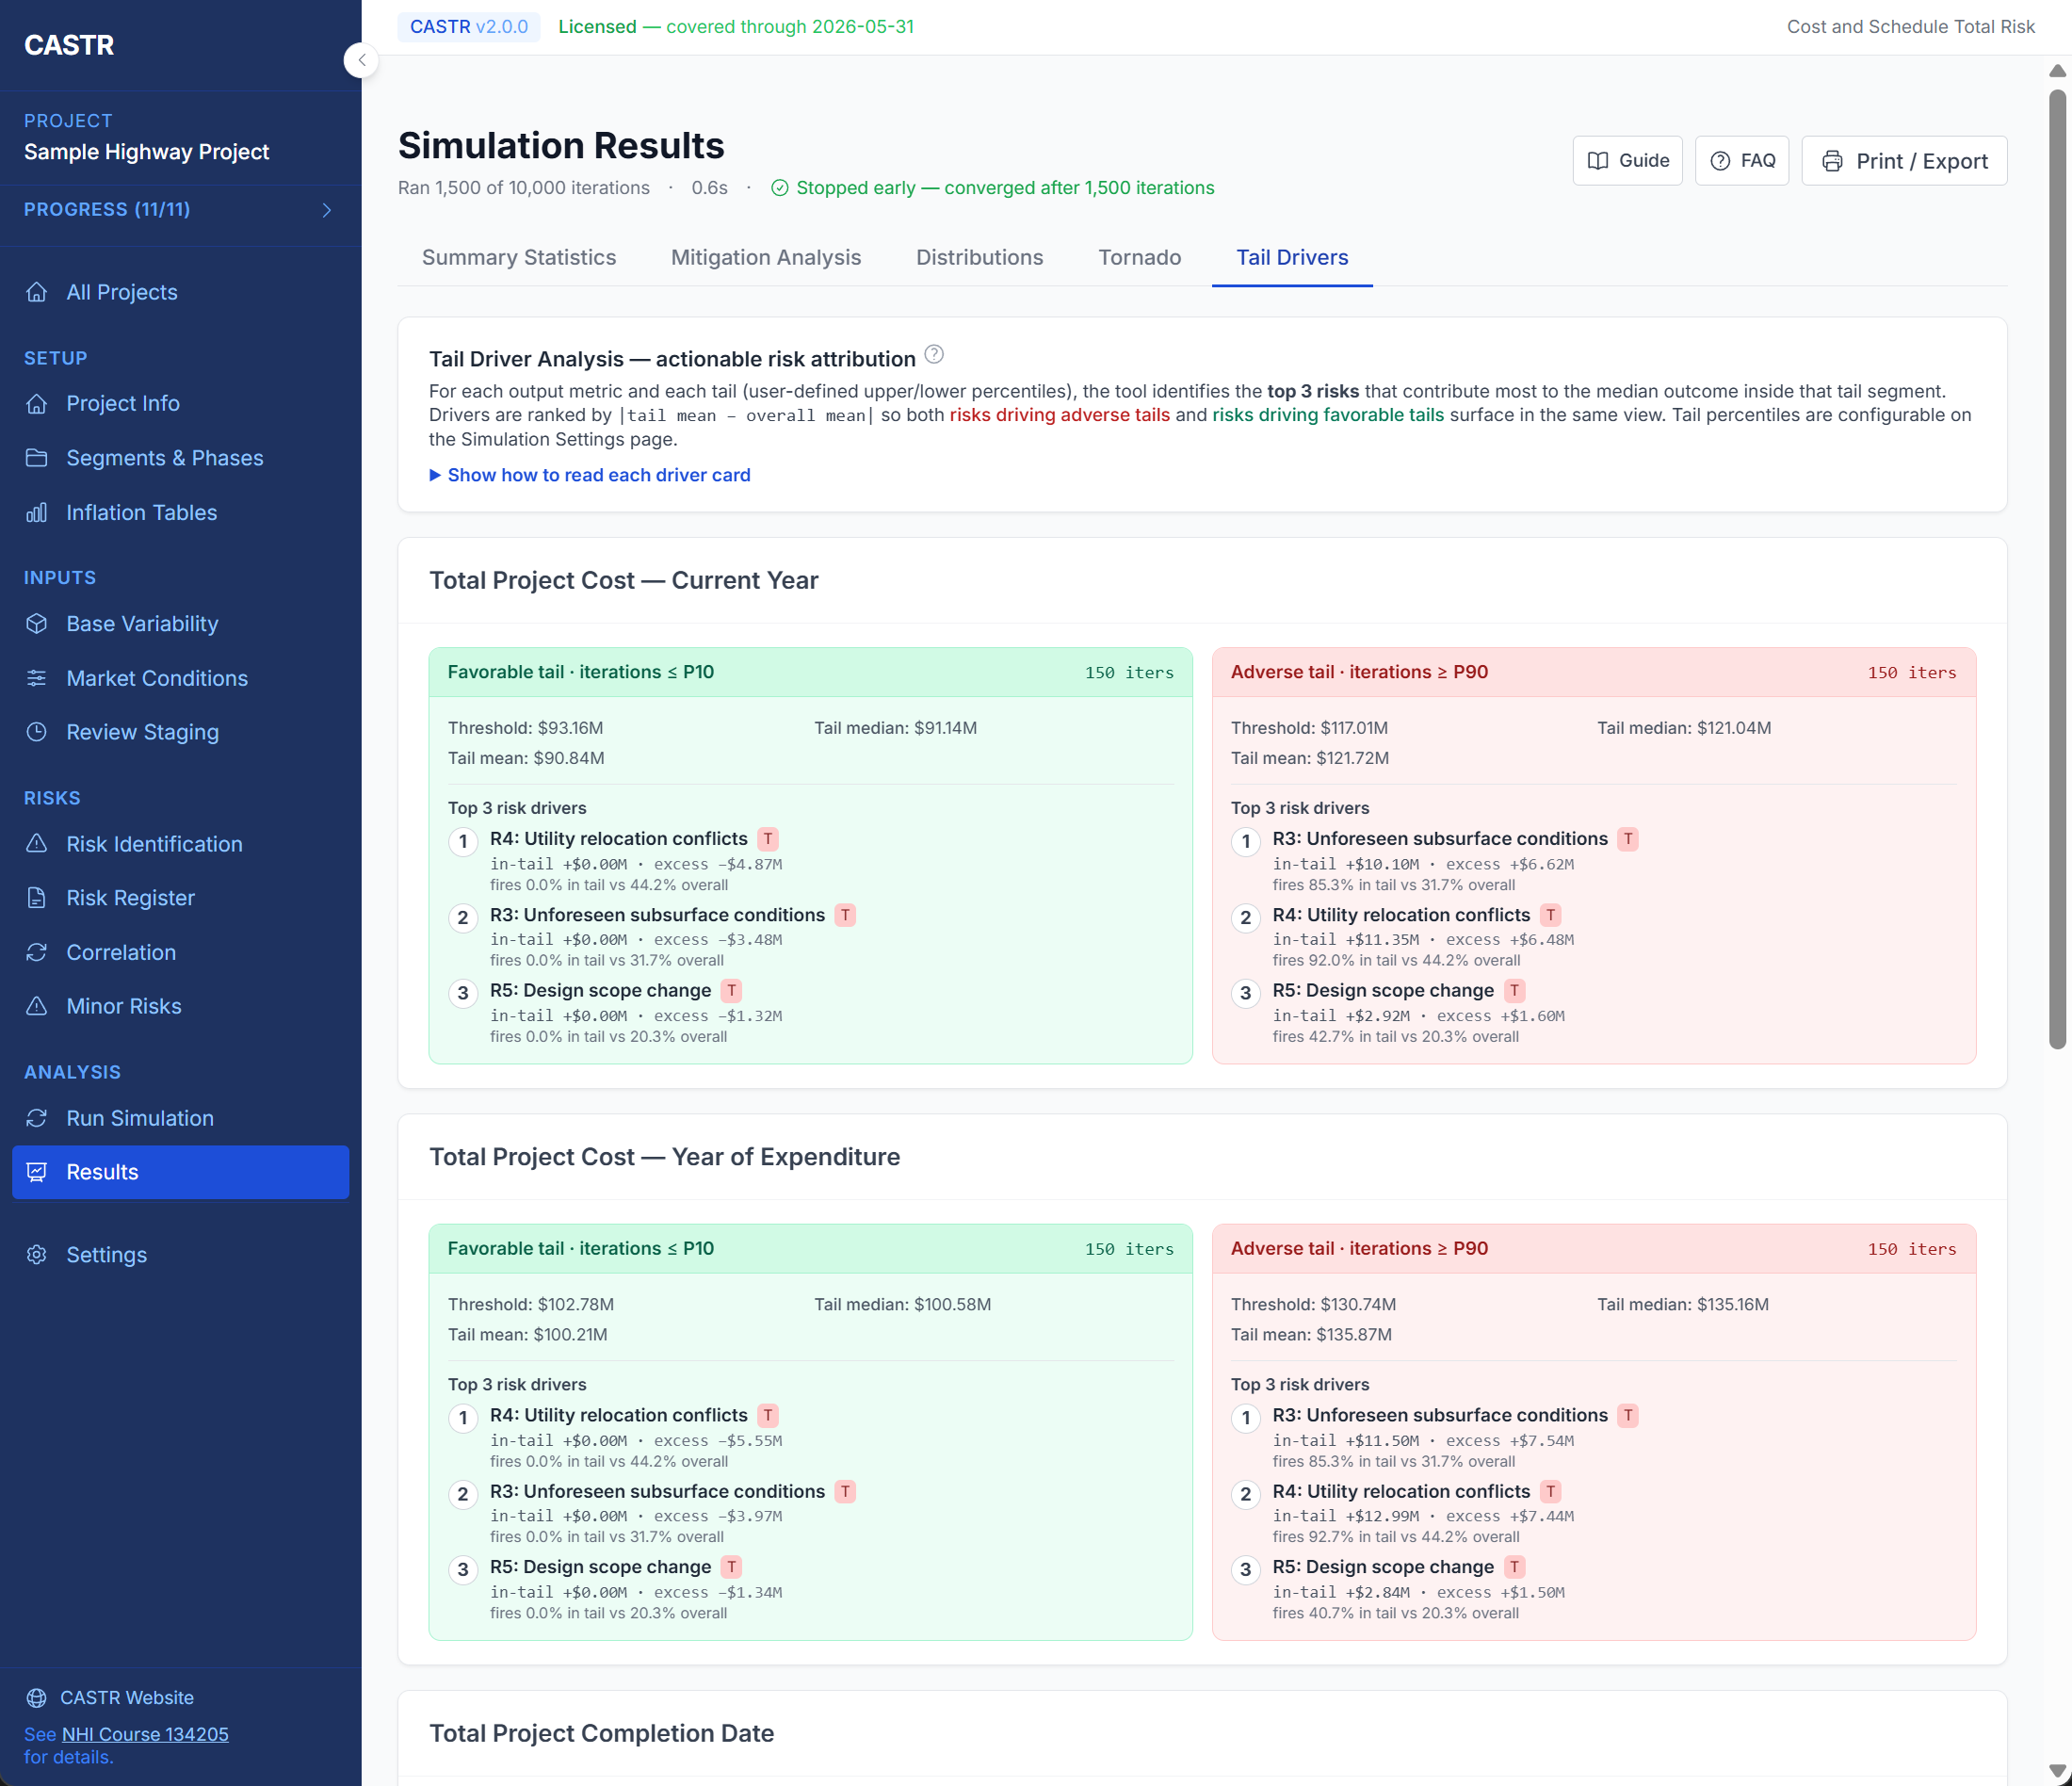
Understand which risks drive extreme outcomes with fire rate comparison, excess contribution metrics, and plain-language interpretations. Confidence chips (Reliable/Review/Insufficient) on each tail card show whether rankings are stable enough to defend.
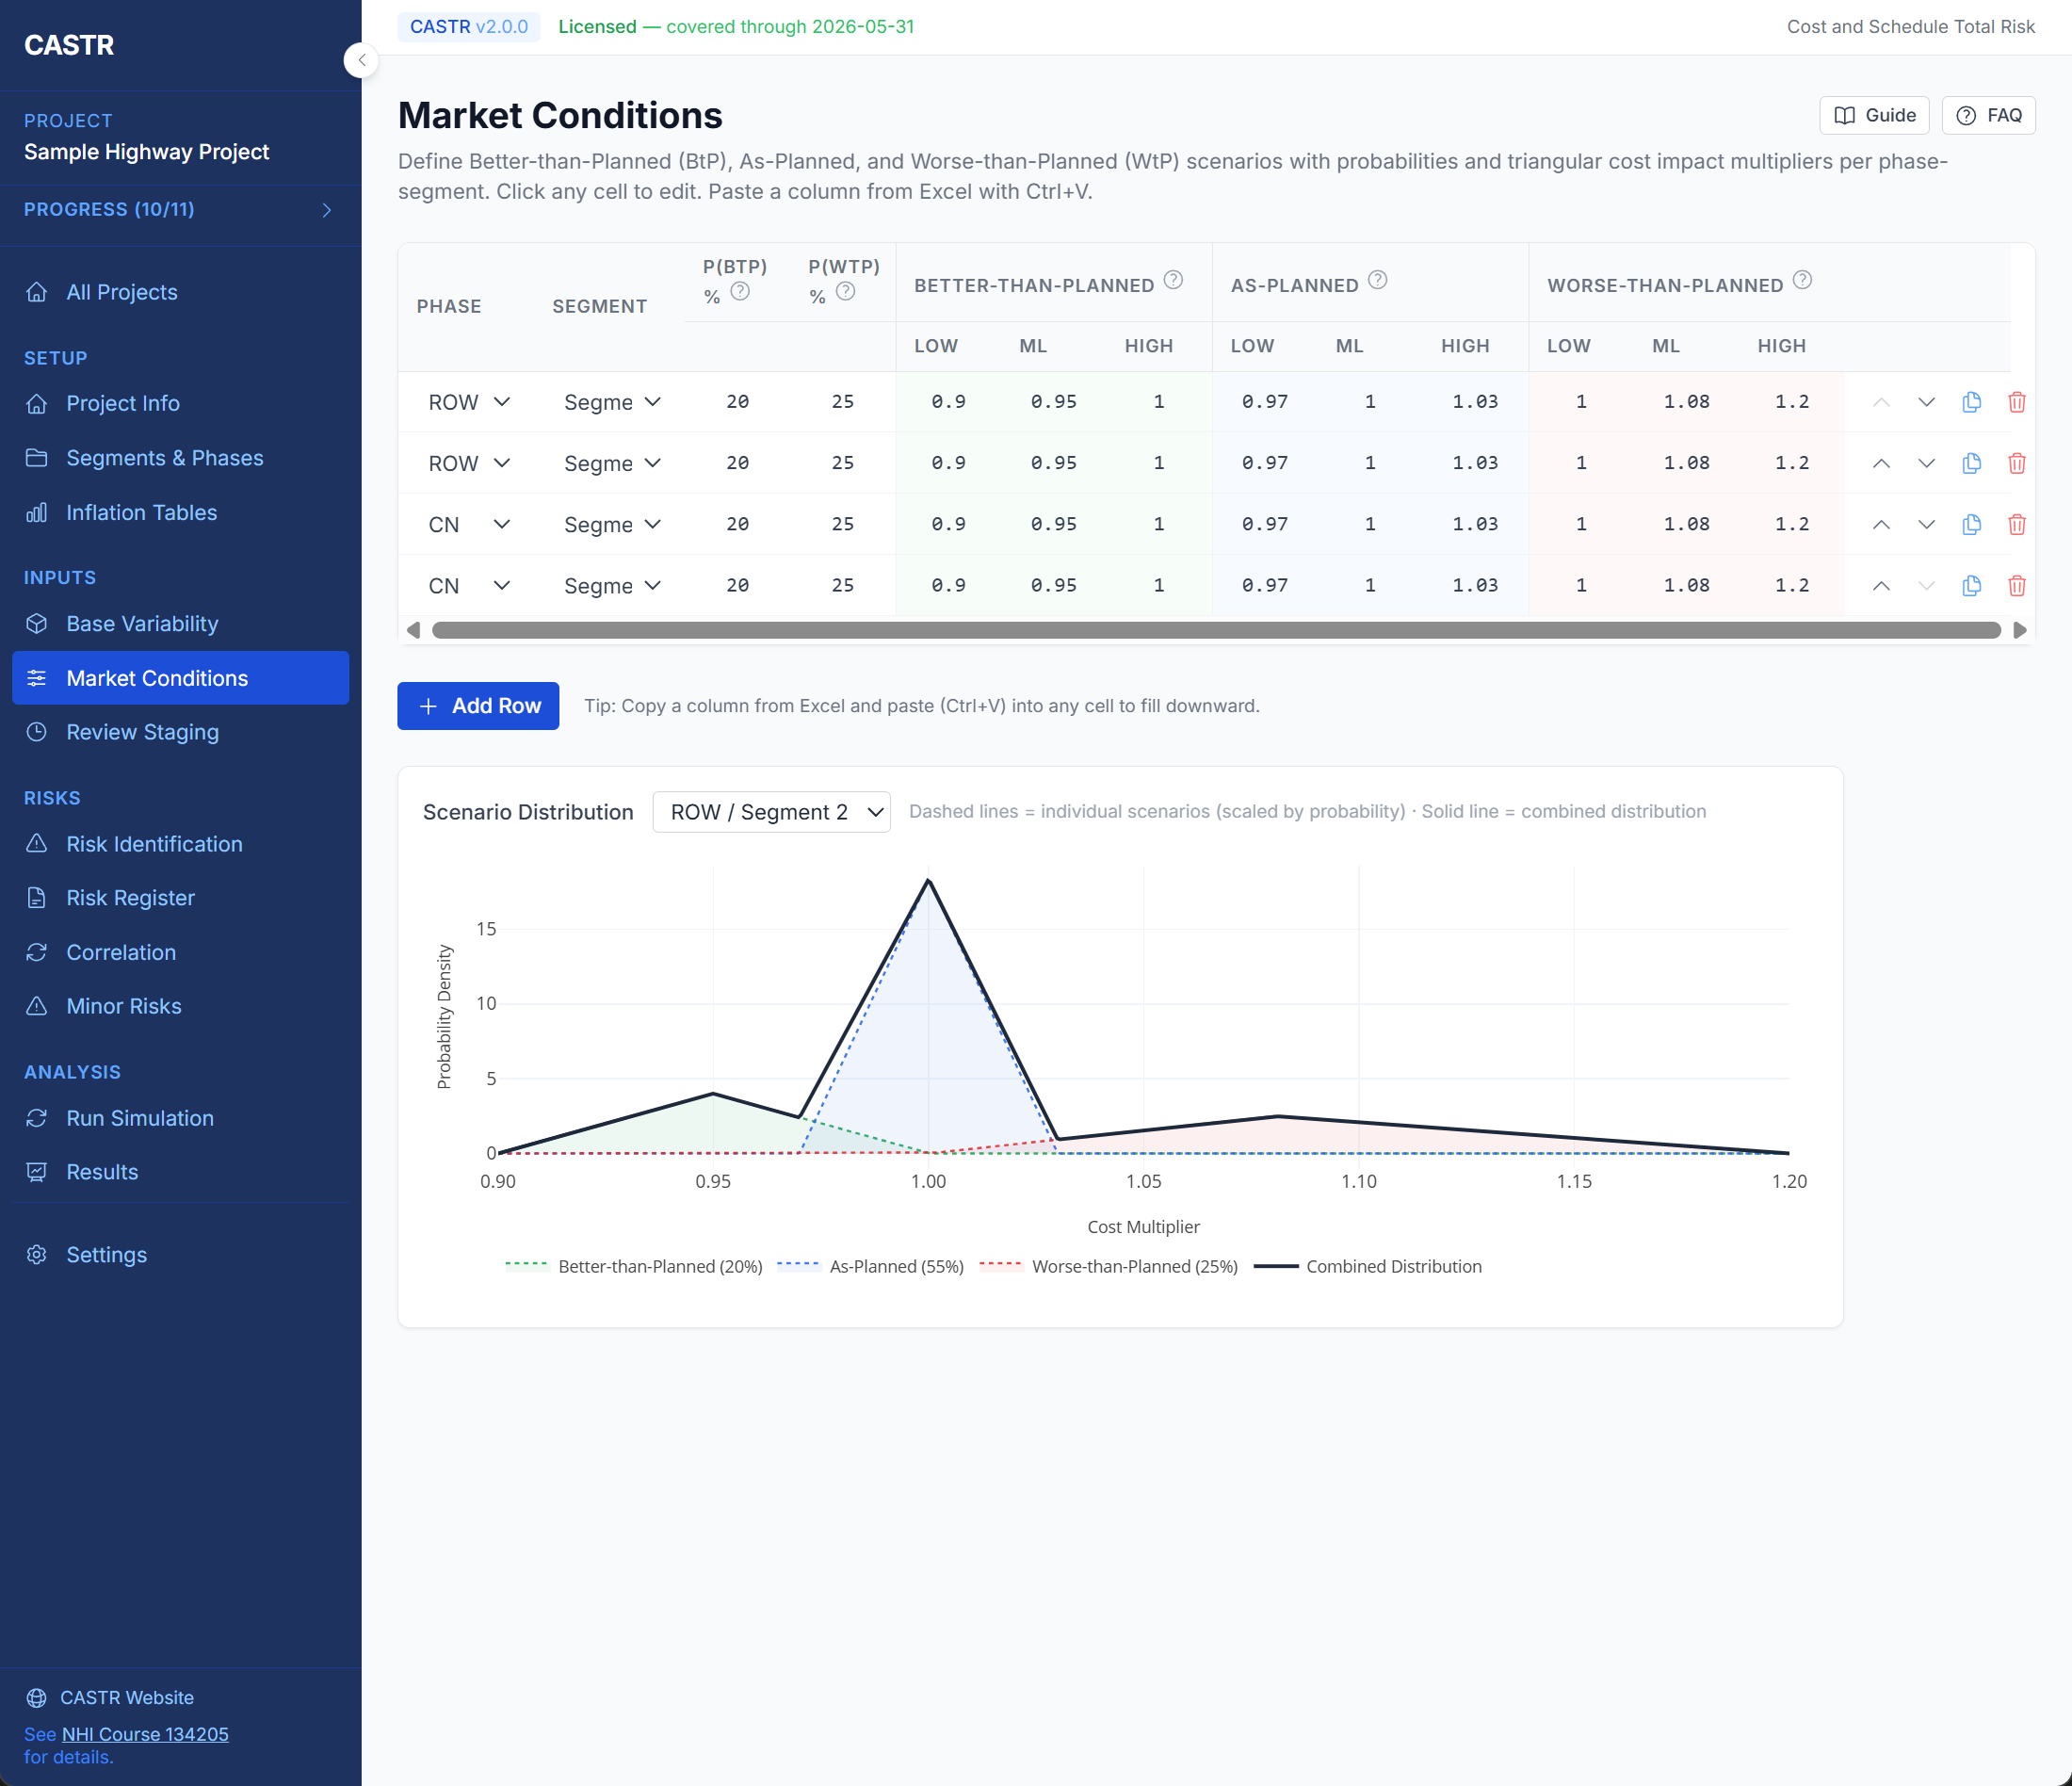
Model Better-Than-Planned, As-Planned, and Worse-Than-Planned market scenarios with probability-weighted cost multipliers.
Define cost-cost, schedule-schedule, and cost-schedule cross-pair correlations using a Gaussian copula with one-to-many entry: multi-select Variable B picker with search, select-all, and conflict handling. Automatic PSD matrix repair via Higham algorithm with an achieved-vs-requested correlation report.
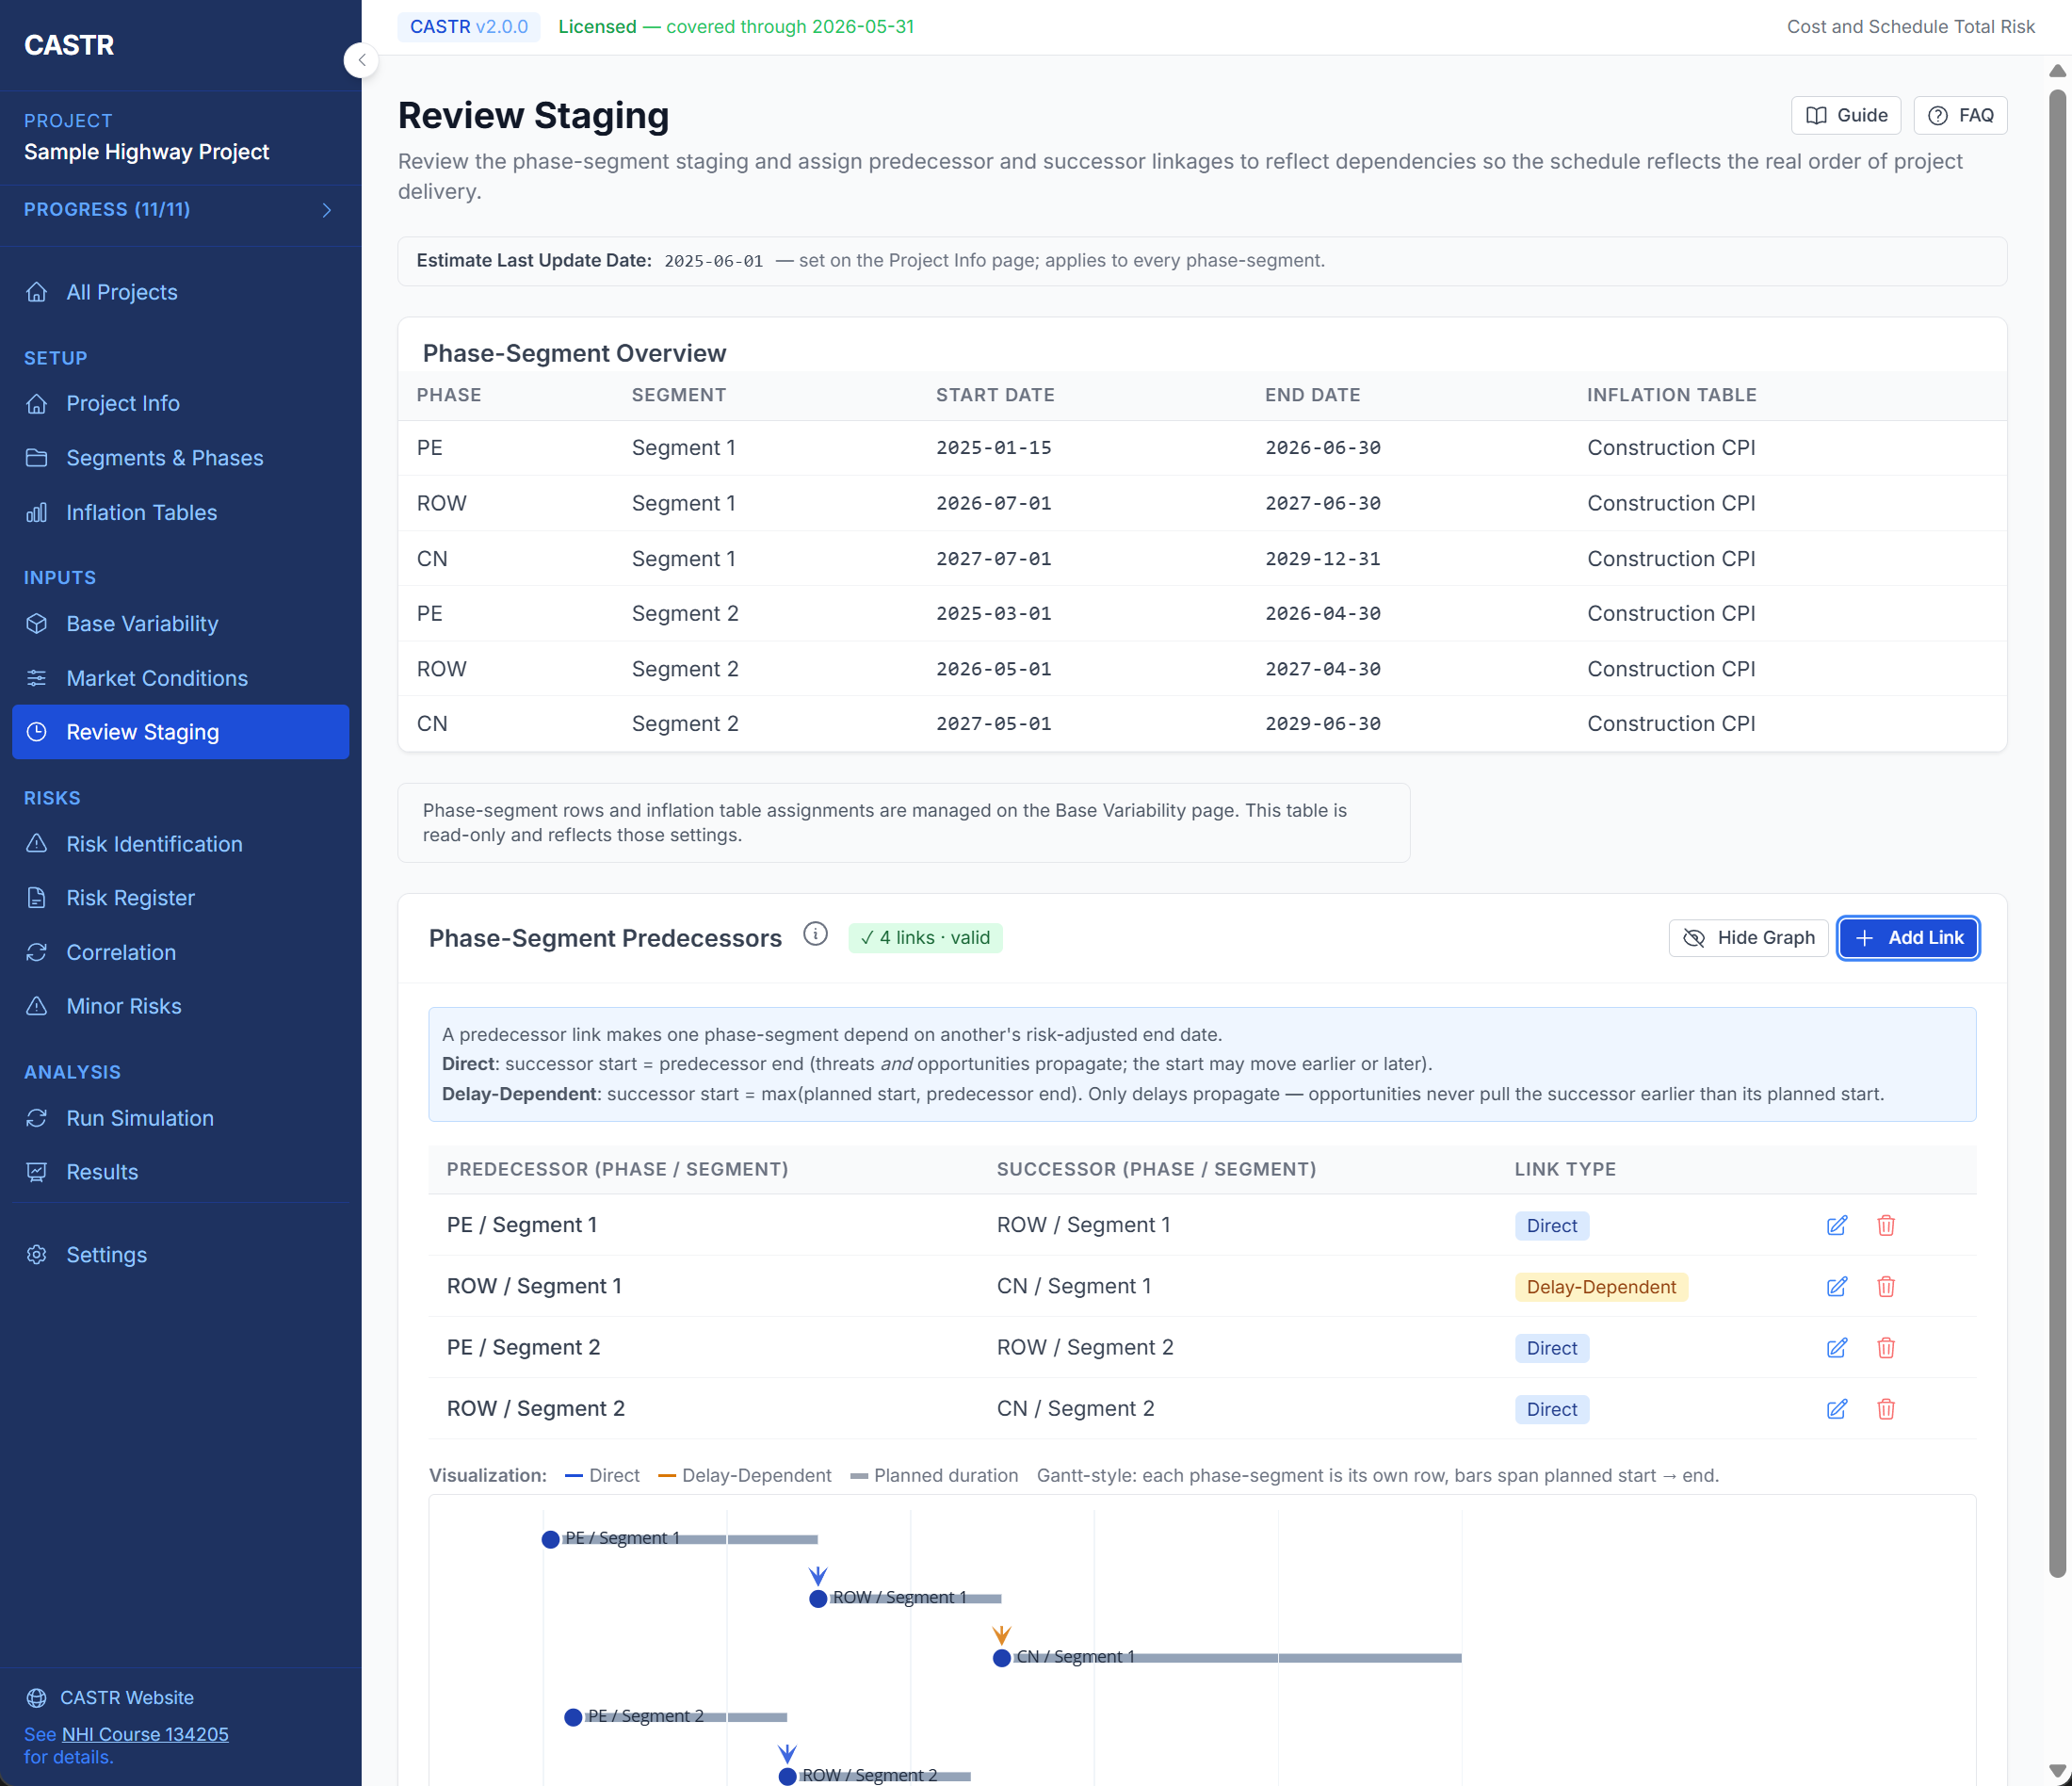
Review phase-segment staging and assign predecessor/successor linkages with Direct or Delay-Dependent rules so the schedule reflects the real order of project delivery. Convert current-year costs to year-of-expenditure dollars with customizable inflation tables.
Comprehensive risk register with customizable column presets (Brief, Standard, Full, Custom), row locking, MIT toggle, status tracking (Active/Inactive/Closed), orphan detection, and auto-sync from Risk Identification.
Import risks from Excel templates with preview-before-commit and validation. Export risk registers to CSV/Excel. Generate Word (.docx) reports with embedded charts. Backup/restore complete projects with versioned manifests.
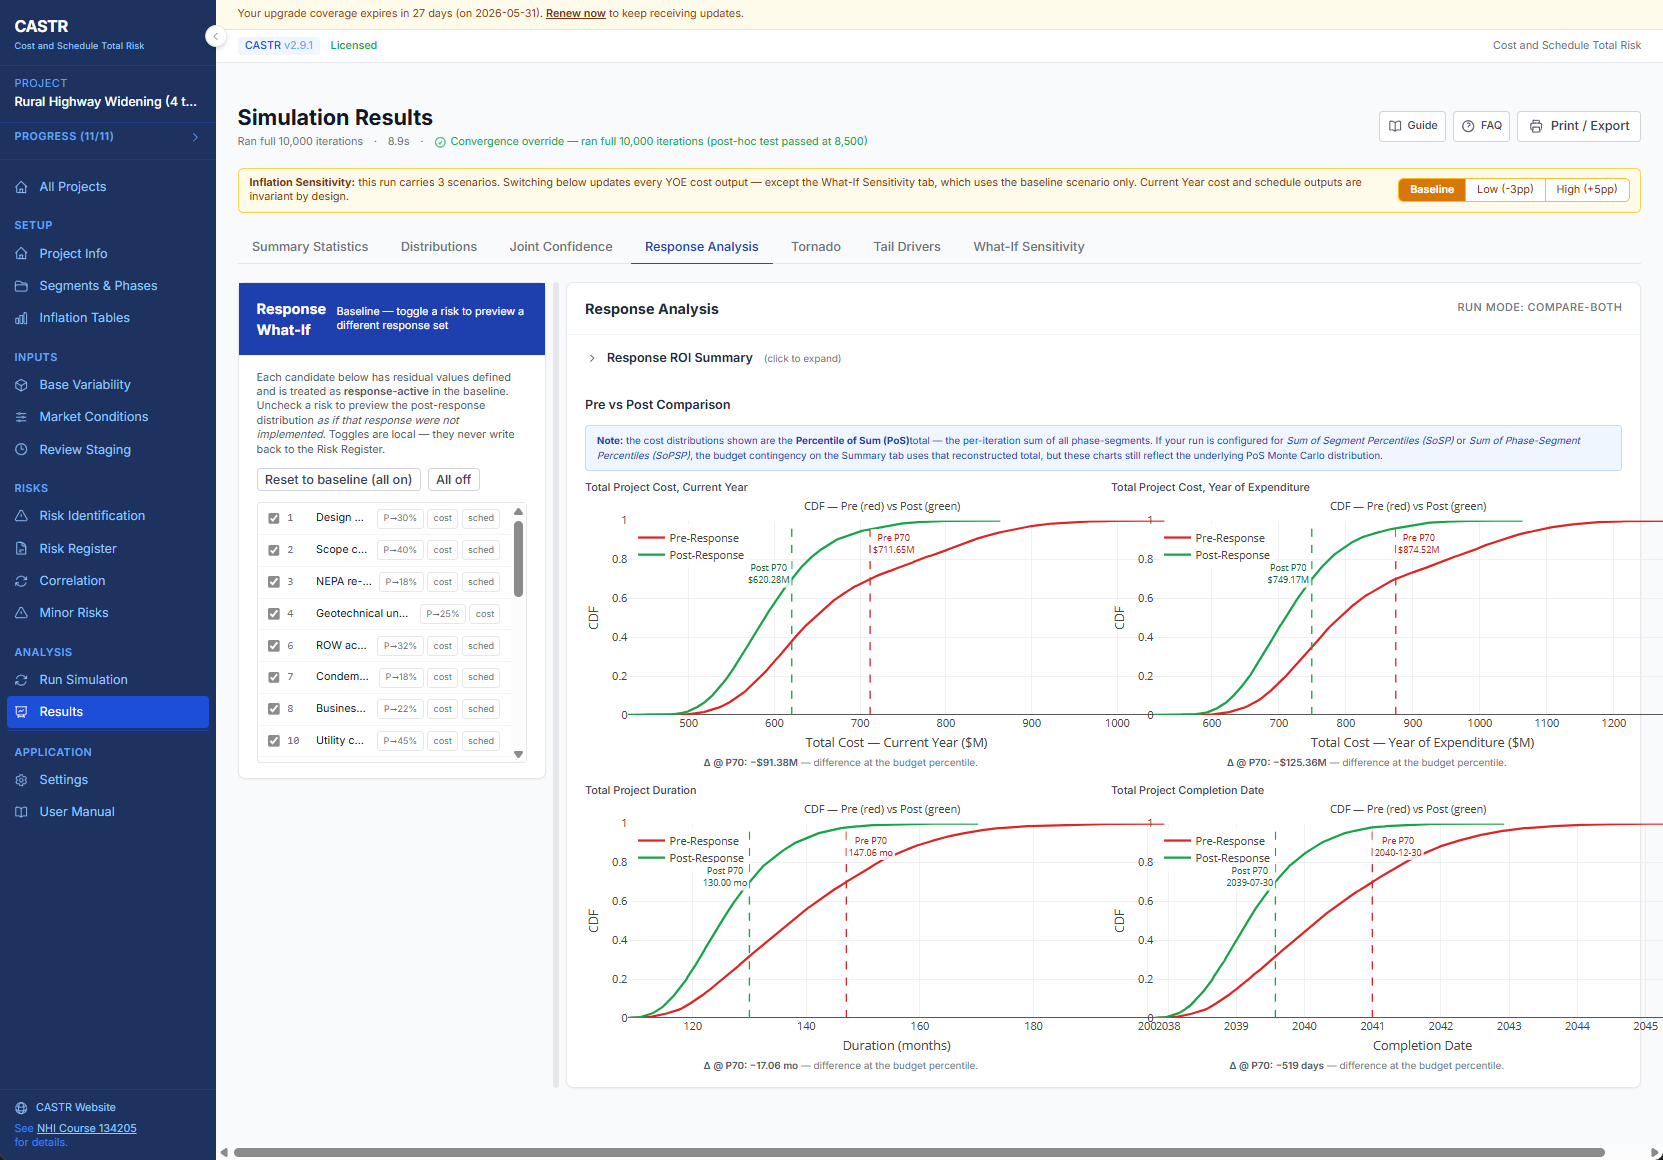
Per-axis PMI response strategies (Threat: Accept/Avoid/Escalate/Mitigate/Transfer; Opportunity: Accept/Enhance/Escalate/Exploit/Share) with response cost, owner, due date, and stale-date warnings. Pre- vs. post-response simulation with overlay charts and ROI table in both CY and YOE-by-scenario views.
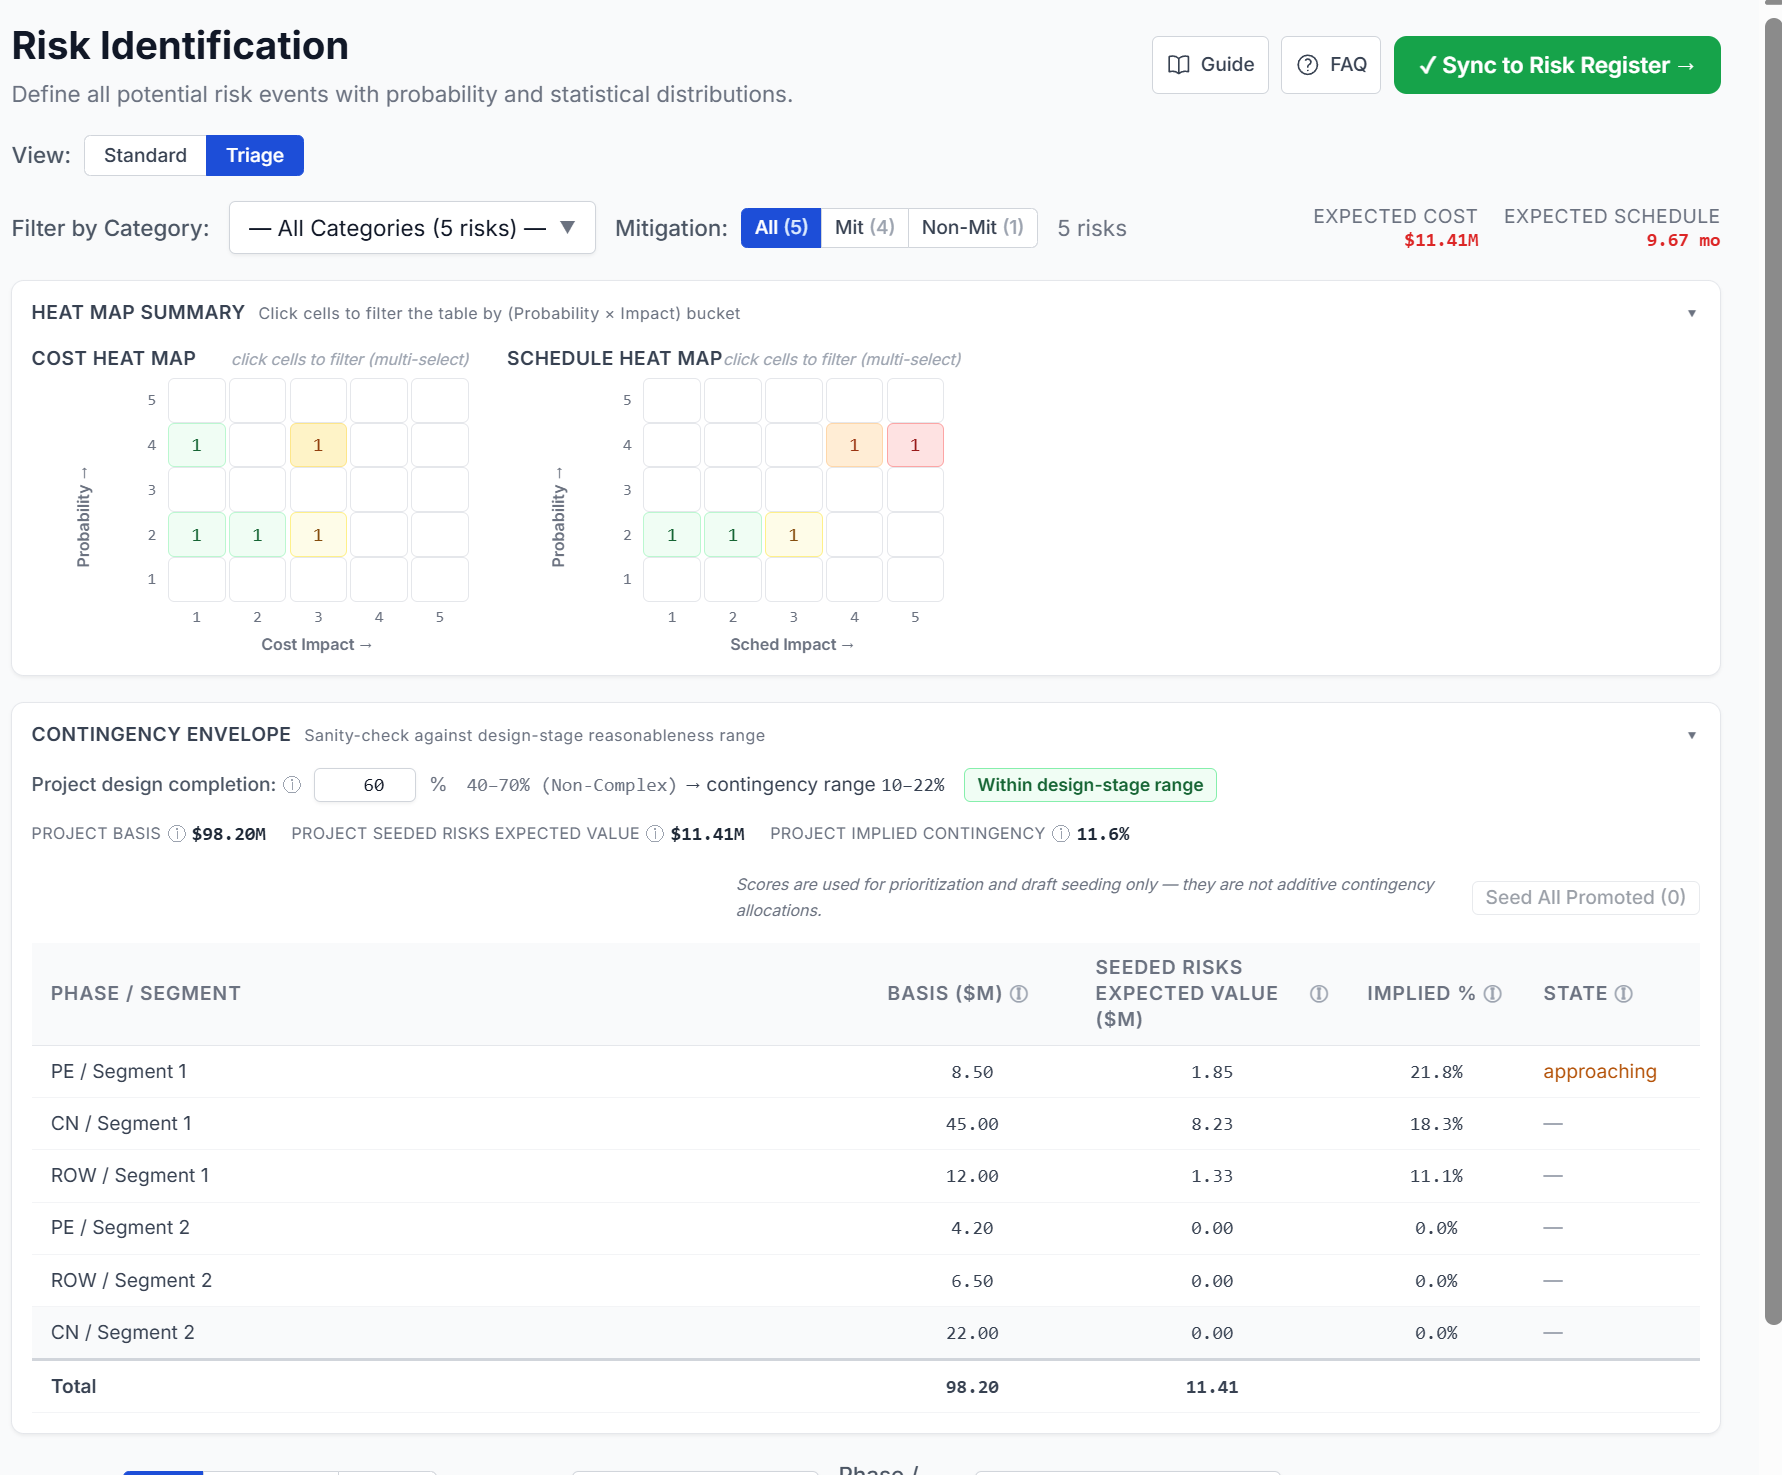
Score risks 1–5 for probability, cost, and schedule impact. Two 5×5 heat maps with click-to-filter cells. Seed button auto-generates Triangular distributions from triage scores. Contingency Envelope card benchmarks against AASHTO/design-stage bands per project complexity.
Ships with 25 risk categories and 168 default risk events synthesized from FHWA Major Projects guidance, Caltrans PRMHB, WSDOT CEVP/CRA, FDOT PMG 405, GDOT PDP, and NCHRP 08-60. Each risk is tagged by primary impact (Cost/Schedule/Both), typical phase, and project complexity tier (Non-Complex, Moderately Complex, Most Complex). Filter the picker by category, complexity, impact, or phase to build a project-specific register in seconds.
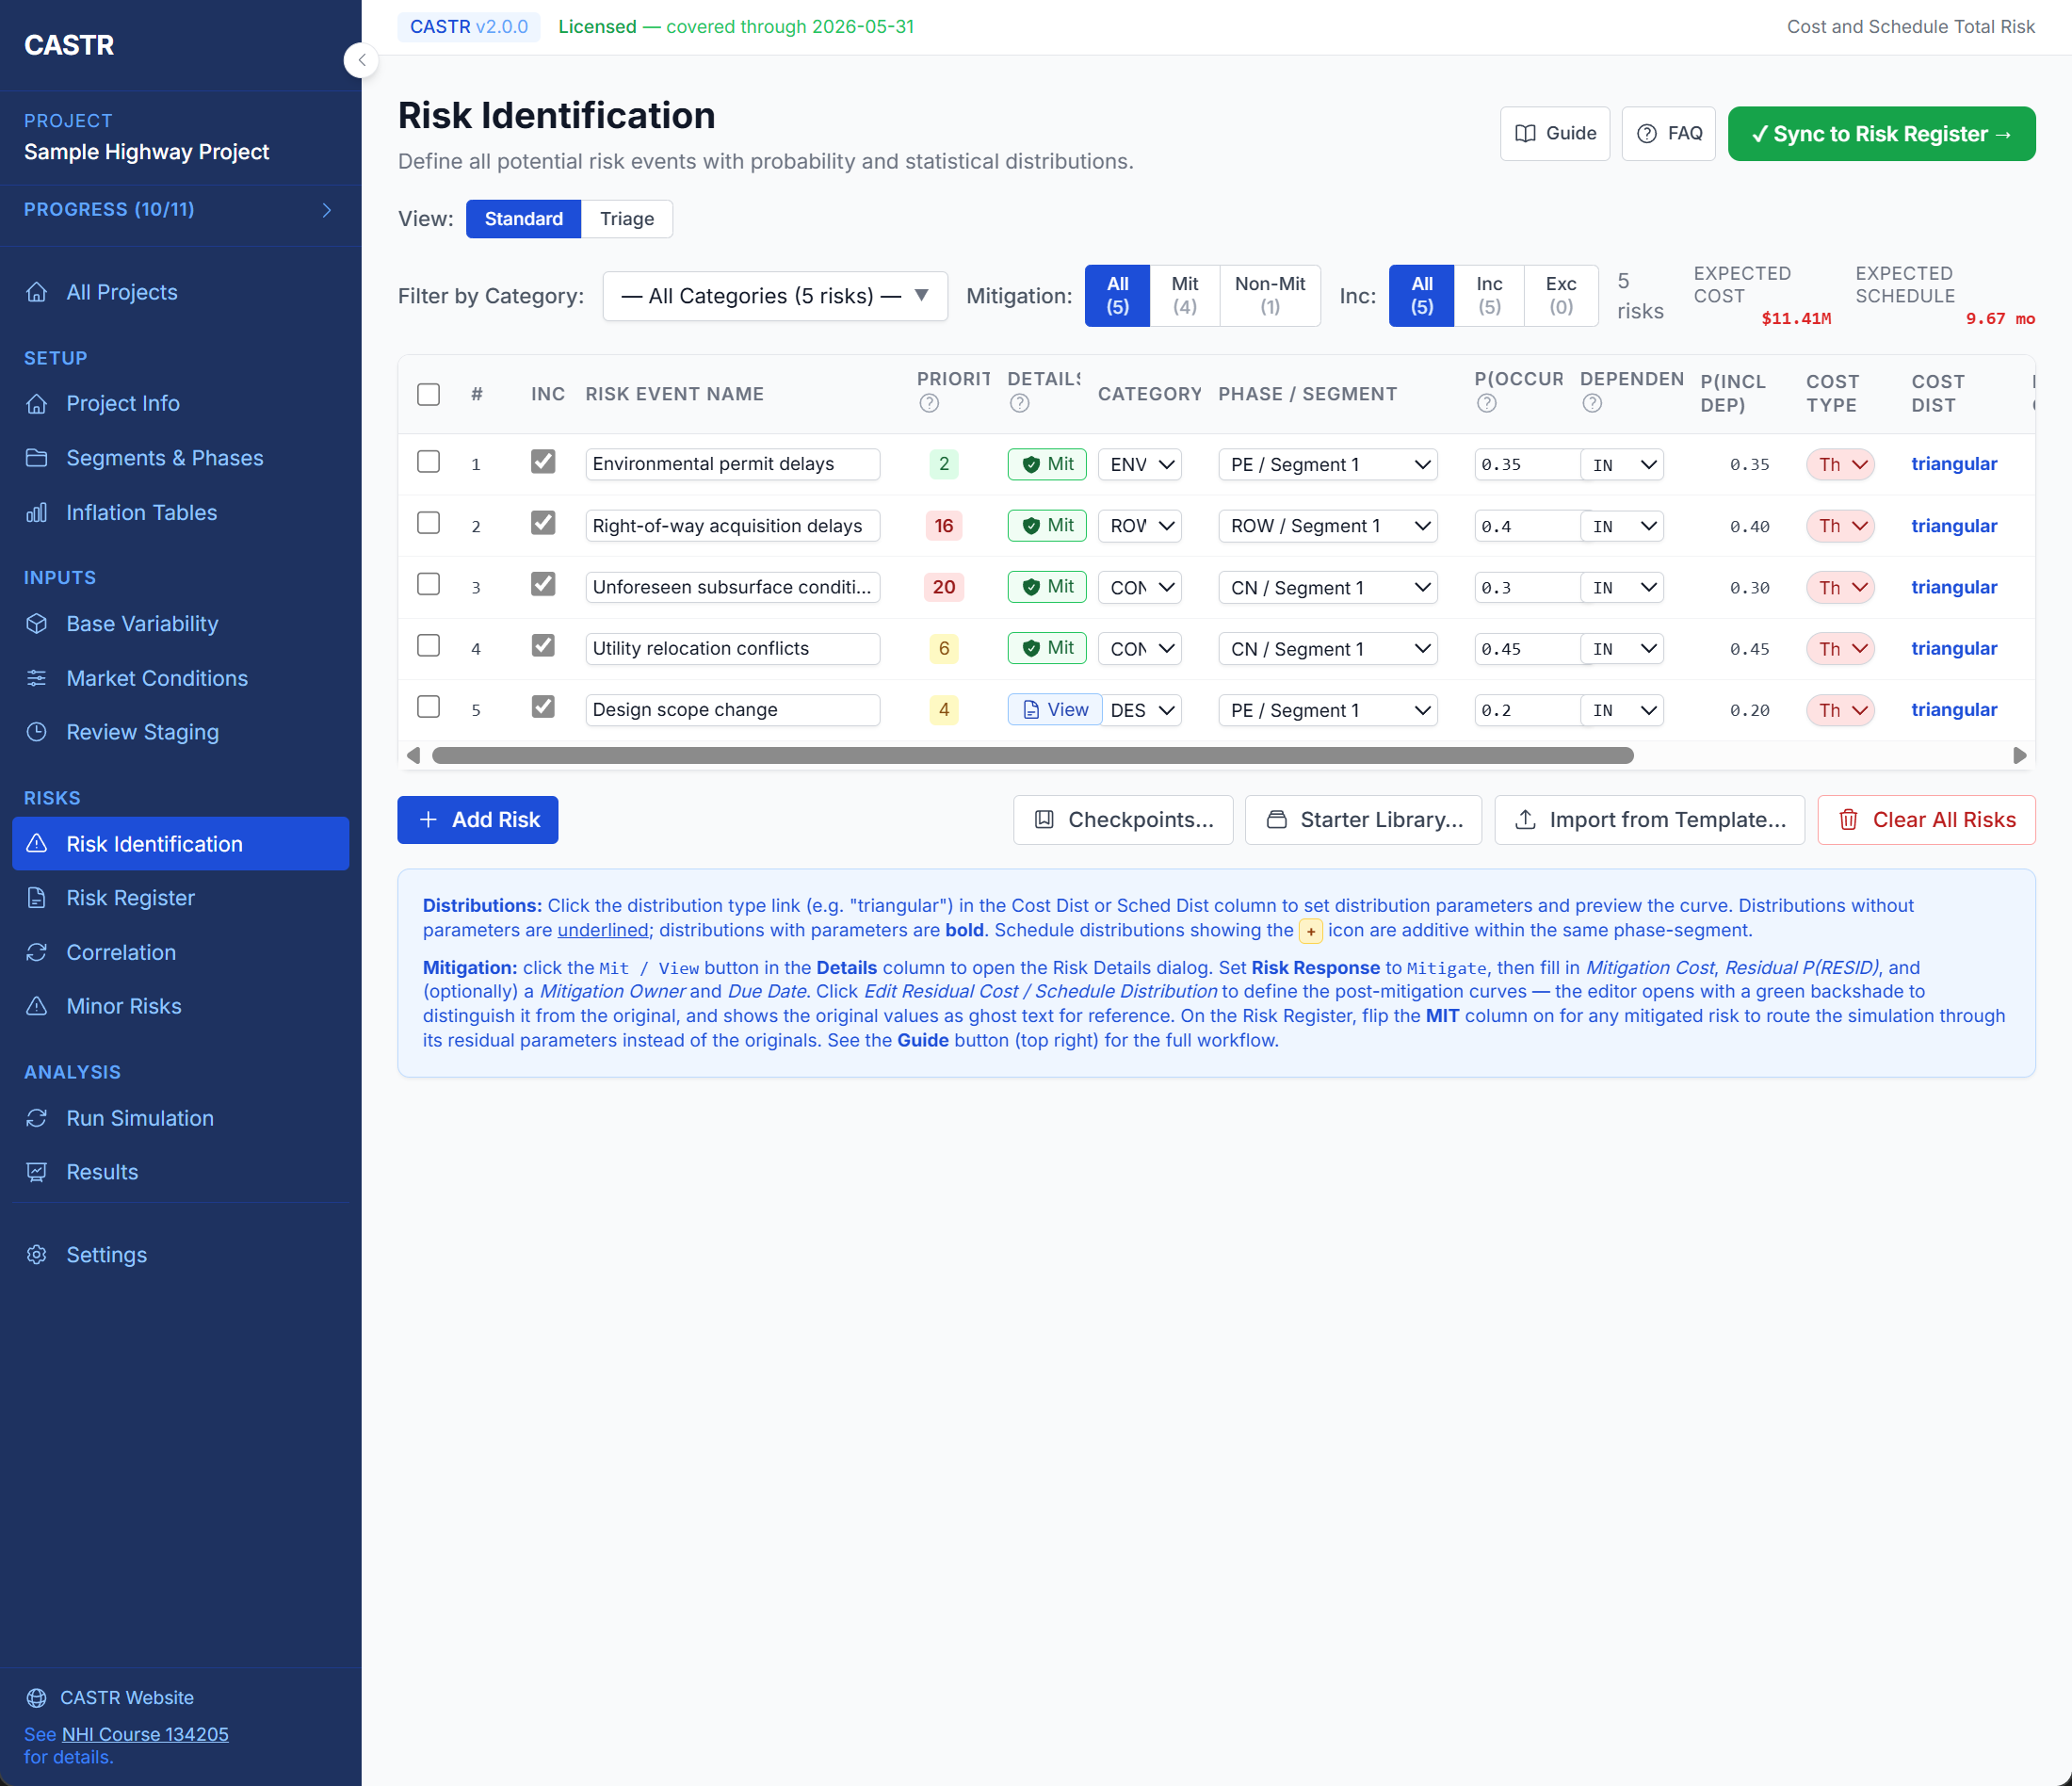
Triangular, BetaPERT, Uniform, and Normal distributions with parameter validation and live PDF/CDF preview. Model risk dependencies as mutually inclusive, mutually exclusive, or project-wide with auto-computed effective probability.
Choose Percentile of Sum (PoS, NHI-134205 default), Sum of Phase-Segment Percentiles (SoPSP), or Sum of Segment Percentiles (SoSP). Reconstructed distribution charts reconcile visually with the chosen method.
Run the same simulation across multiple inflation deltas (e.g., -3%, baseline, +5%) using cached random draws so all scenarios are bit-for-bit comparable. Sensitivity curve chart for inflation-delta extrapolation.
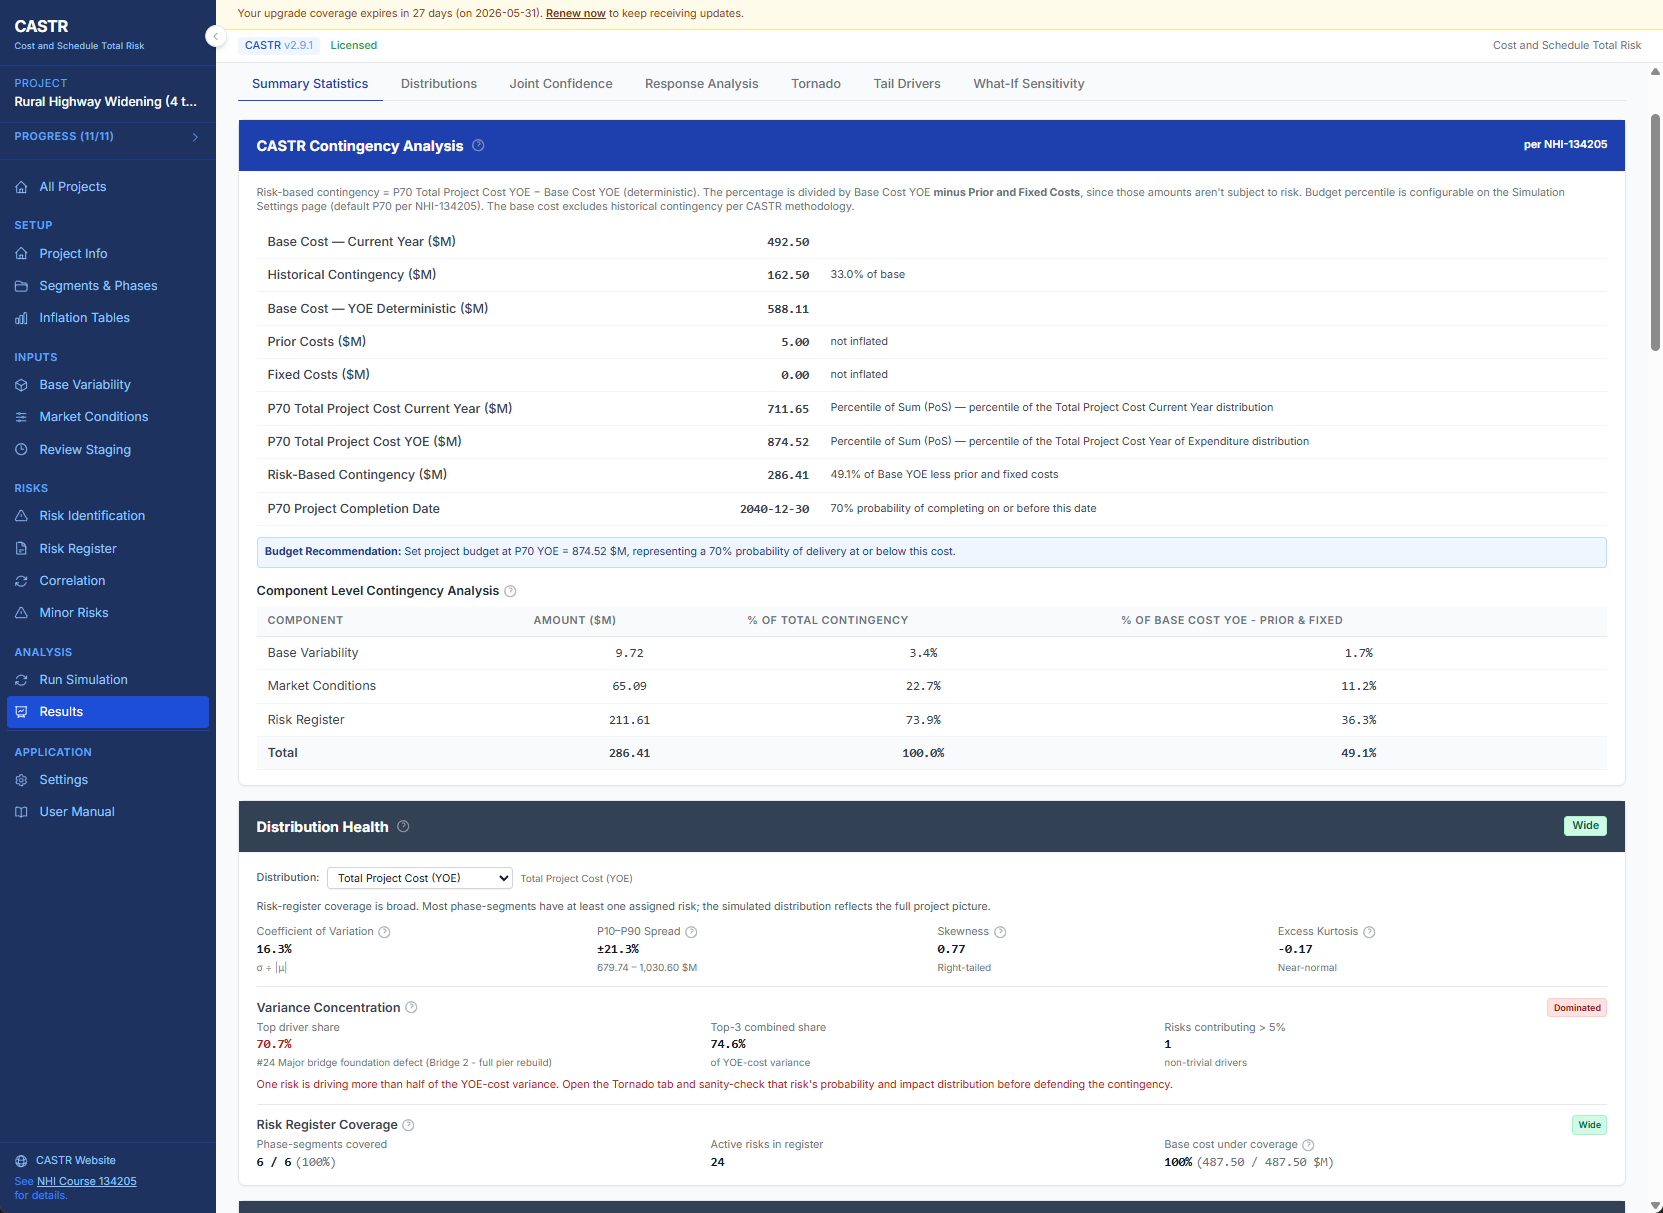
Coverage-driven traffic light, P10–P90 spread, skewness, excess kurtosis, variance concentration (Dominated/Concentrated/Broadly sourced), and component analysis decomposing contingency into Base Variability, Market Conditions, and Risk Register contributions.
Convergence diagnostics saved with every run. Achieved correlation report vs. requested coefficients. Full run history with settings snapshots. Stale-results banner when inputs change after the last simulation. Pre-run validation gate.
Tailor cost and schedule scoring tables plus contingency envelope bands to match your agency's standards. Scaling factors let you bulk-adjust all Low/Mode/High cells at once.
Multi-layer guidance system: page-level guides, contextual FAQ panels, tooltips, and a progress checklist. Pre-run validation catches gaps before you simulate.
Save named snapshots during iterative risk workshop sessions. Auto-undo on destructive operations lets you explore freely without fear of losing work.
Model low-impact risks as single expected-value amounts (impact × likelihood) added deterministically each iteration, keeping the risk register focused on what matters most.
Automatic gap detection in market condition scenarios highlights probability gaps between BTP/AP/WTP ranges and flags configuration issues before they affect results.
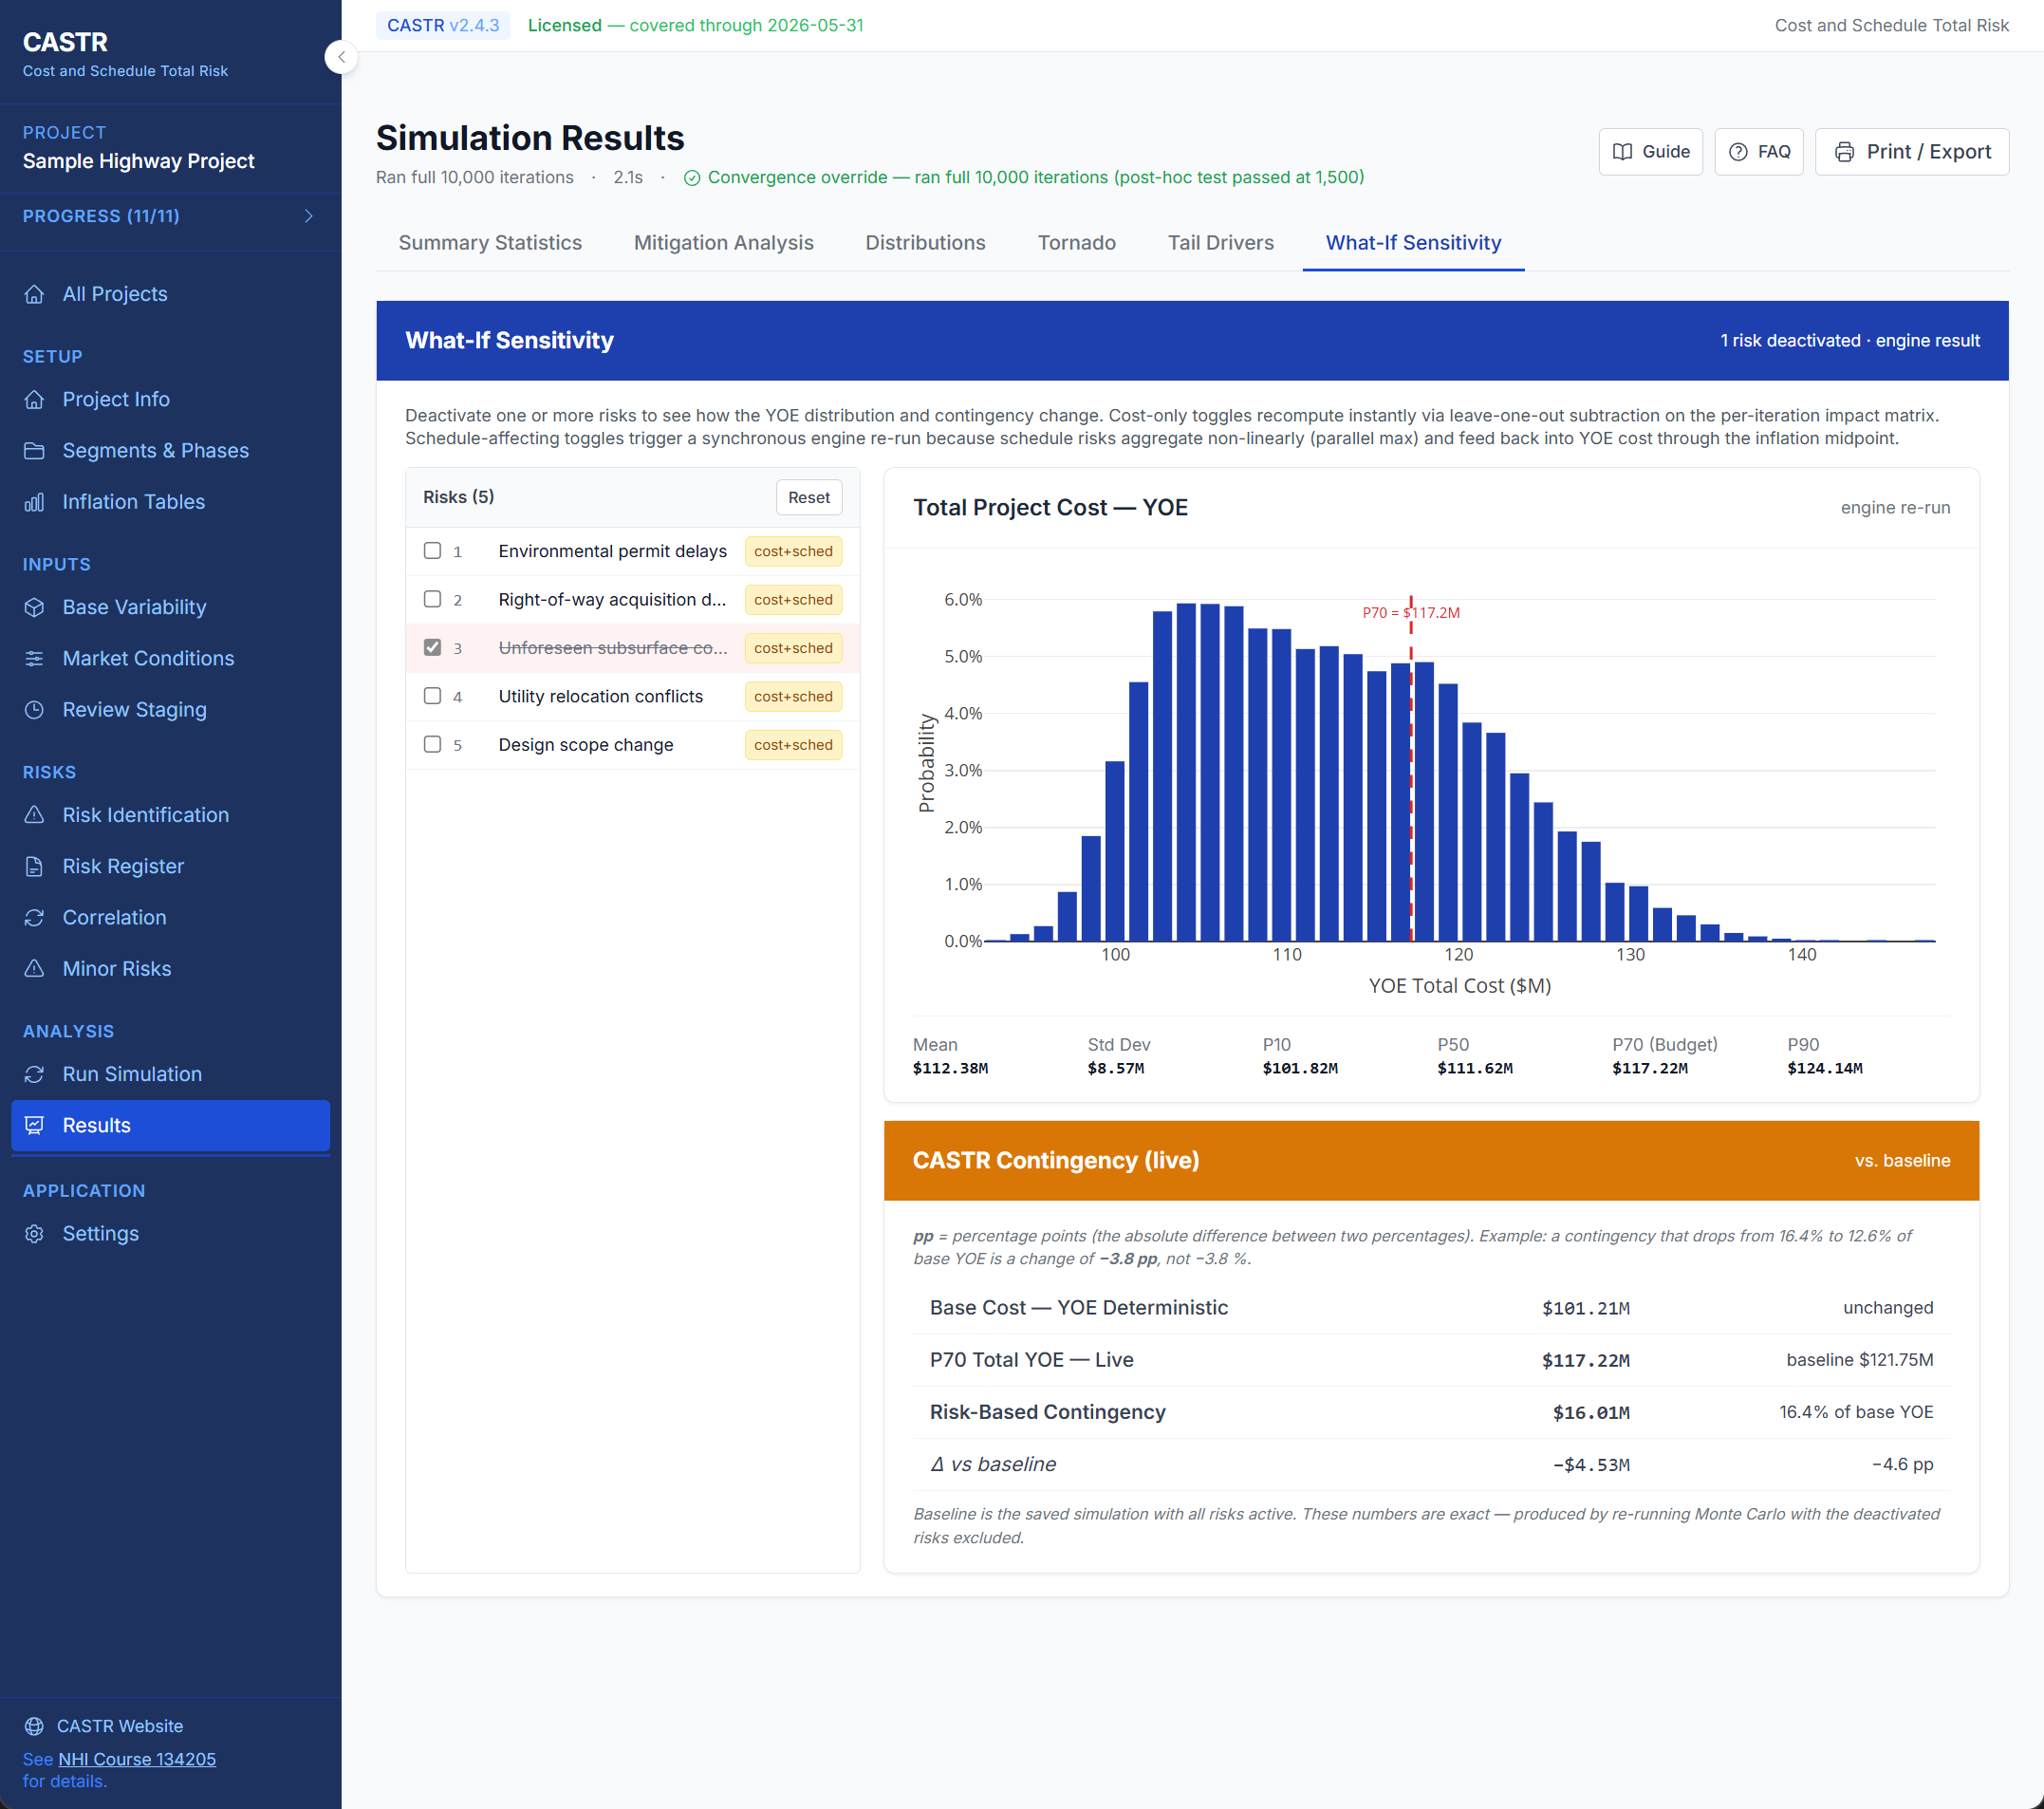
Deactivate risks and instantly see how the YOE distribution and contingency shift using a hybrid recompute engine — cost-only changes resolve client-side via a leave-one-out impact matrix; schedule-affecting changes trigger a synchronous engine re-run. Response What-If panel shows the impact of planned risk responses. Duration and Completion Date metric views with per-axis Threat/Opportunity colored chips.
Word (.docx) report generation with embedded charts at presentation-friendly font sizes. 300 DPI PNG chart downloads for sharp Office insertion. Print-to-PDF with scenario-aware section duplication. CSV/Excel risk register export.
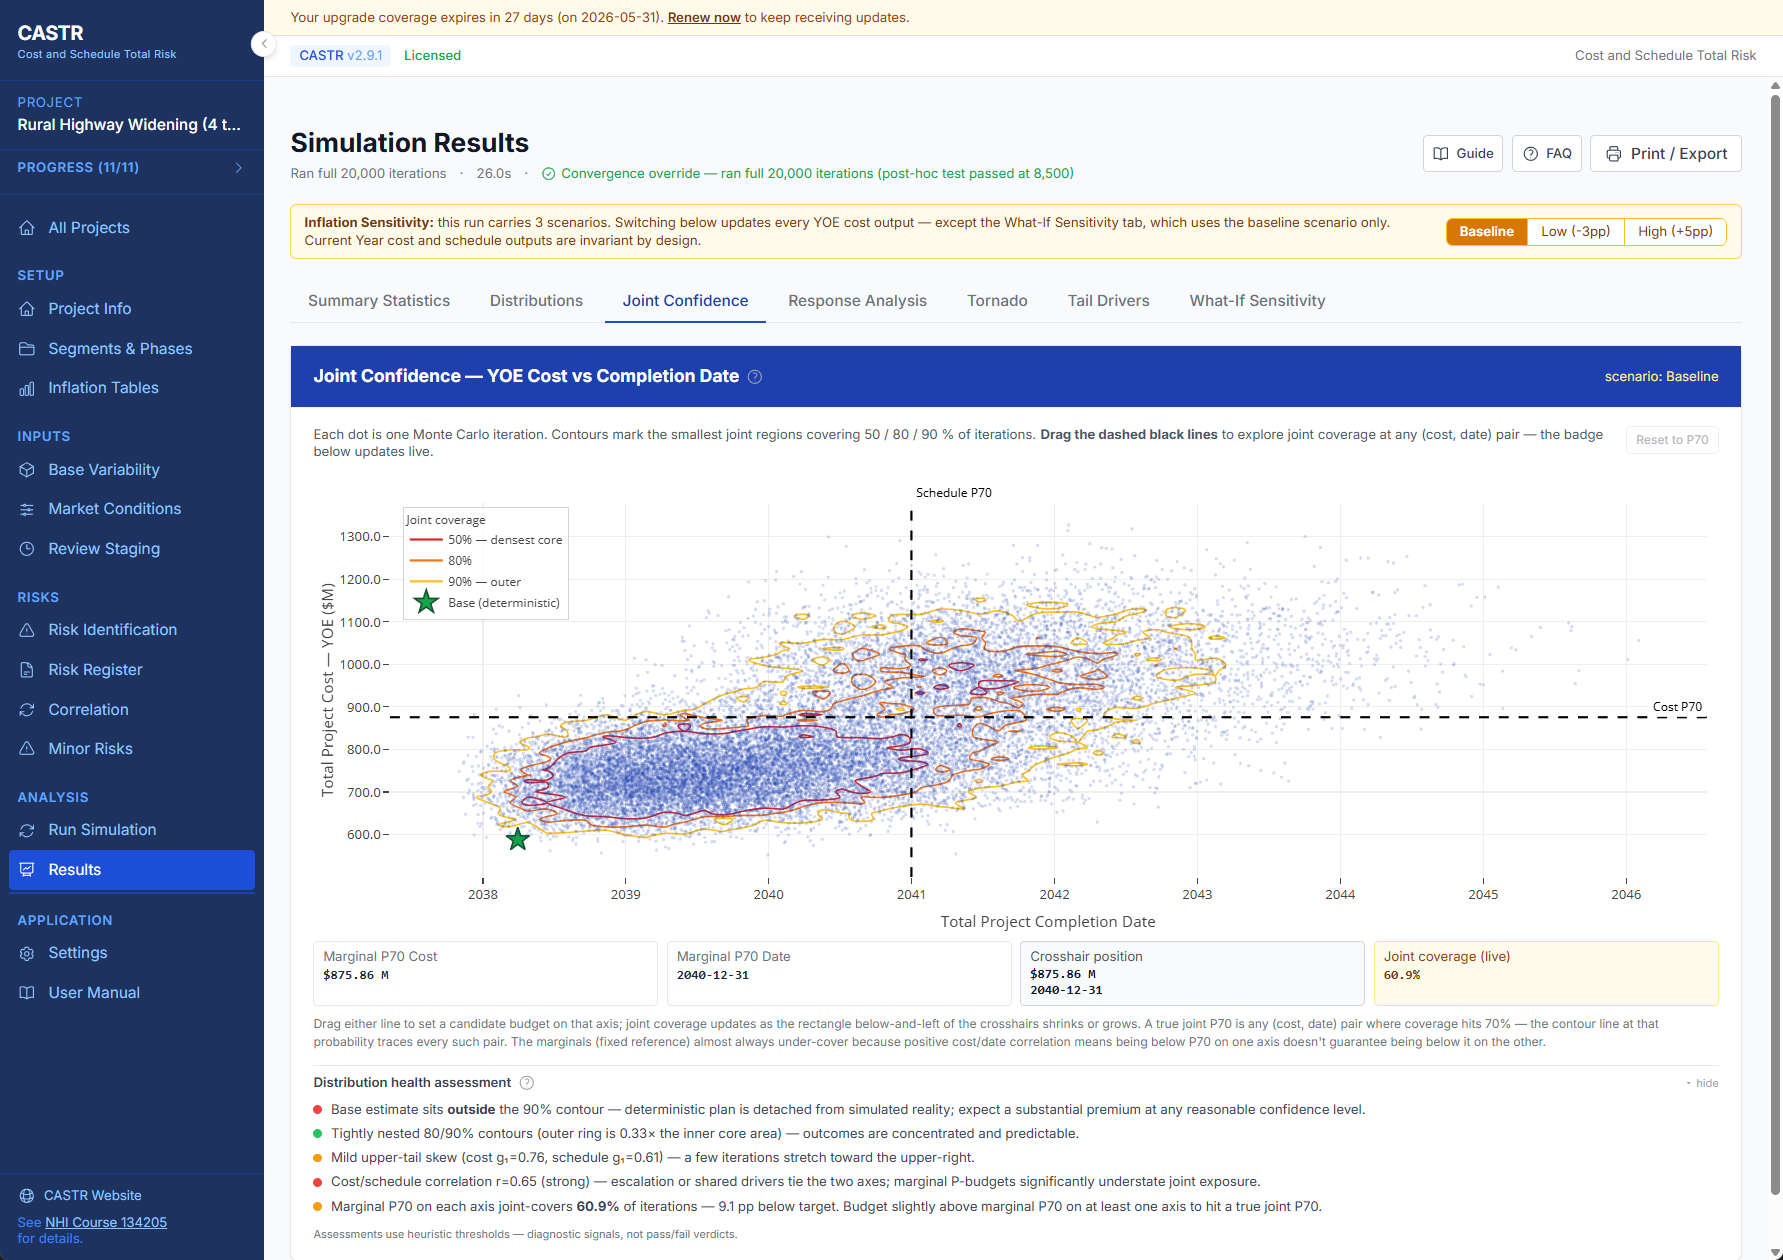
Scatter cloud plotting joint cost vs. completion date outcomes with density contours at 50%, 80%, and 90% confidence. Violet P{budget} curve, draggable crosshairs, and a 5-bullet Distribution Health Assessment panel checking ring tightness, skewness, correlation, and coverage.
Cost and schedule axes carry independent PMI response strategies. Separate dropdowns for Cost Response and Schedule Response with polarity-appropriate options: Threat (Accept/Avoid/Escalate/Mitigate/Transfer) and Opportunity (Accept/Enhance/Escalate/Exploit/Share).
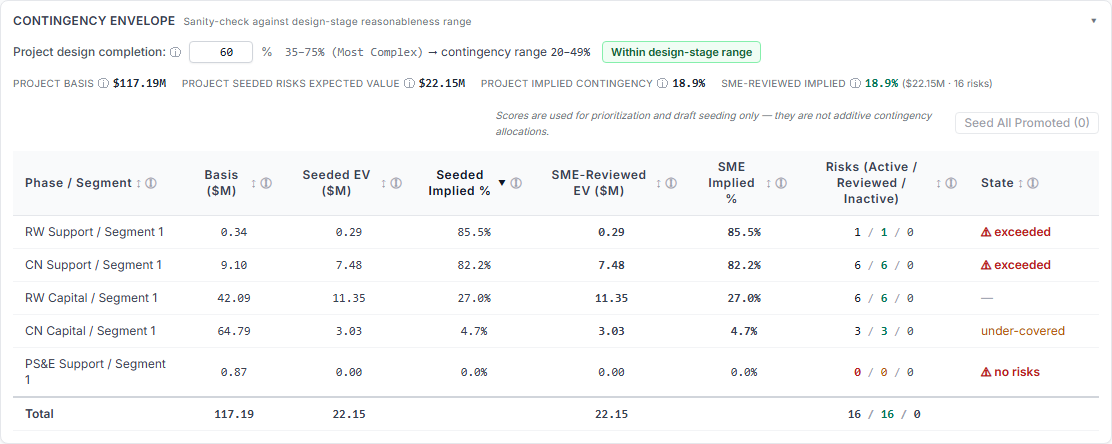
Track which seeded risks have been ratified by the workshop. Contingency Envelope cards show Seeded vs. SME-Reviewed risk counts with a three-way column (Active/Reviewed/Inactive). Standard view envelope card benchmarks coverage at a glance.
Generate per-owner Print/Word documents so each risk owner gets only their assigned risks. Customizable column selection lets you tailor the report content for different audiences.
Assign the same correlation coefficient from one Variable A to multiple Variable B targets in a single operation. Multi-select picker with search, select-all, and automatic conflict handling when existing pairs are overwritten.
Bulk-load your agency's risk categories and events into the Starter Library from Excel. Three-step wizard: download the pre-filled template (all 25 categories and 168 defaults included), edit in place, upload and commit. Import is additive and idempotent—re-importing the same file is safe. Independent Restore Defaults buttons let you reset categories or risks separately.
Answer the workshop-defense question: if every phase-segment slips by N years, how much more budget do we need? Pick a 1–5 year delay from the dropdown and instantly see Base Cost YOE, Risk-Based Contingency, and Budget Total YOE deltas for each inflation scenario.
Decompose the budget-percentile Total Project Cost YOE into three plain-English bars: Base Cost CY, Base Inflation YOE, and Contingency YOE. Dollar values and percentages on each bar make the chart ready to paste into leadership briefing slides.
New installs ship with a fully wired Rural Highway Widening demo project exercising every feature—PoS@P70, tornado and tail drivers, MI/ME dependencies, inflation sensitivity, cost–schedule correlation, and per-axis response ROI. See what “good” looks like before you touch real data.
CASTR is a direct implementation of the risk-based estimating methodology taught in Probabilistic Risk-Based Estimating (PRBE) for Highway Project Cost and Schedule (FHWA-NHI-134205).
If your agency follows the NHI methodology, CASTR automates it end to end — from base variability and market conditions through risk identification, Monte Carlo simulation, and budget-percentile contingency calculation. If your agency uses a different standard, every scoring table and envelope band is fully customizable.
Haven't taken the course? Register for NHI Course 134205 for free on the NHI website.
Set up segments, phases, and cost categories that match your project scope. Define risk categories (ENV, CON, DES, UTIL, ROW) for organized tracking.
Input cost and schedule data with variability ranges. Model market conditions (BTP/AP/WTP), assign inflation tables for YOE conversion, and review staging to define phase-segment dependencies.
Score risks in workshop-style triage sessions, review heat maps, seed starter distributions, then refine with the full distribution editor.
Run Monte Carlo analysis, review tornado charts and tail drivers, define risk response actions, and compare pre- vs. post-response outcomes with ROI tracking.
CASTR turns risk analysis into actionable project intelligence. Identify what threatens your project, quantify how much it matters, and measure the value of your response.
Start with the Starter Risk Library—25 categories and 168 risks covering every major highway discipline—or import from Excel. Filter by project complexity tier, impact, and phase to build your register fast, then triage-score to surface the most critical risks.
Seed starter distributions from triage scores in one click, then refine with Triangular, BetaPERT, Uniform, or Normal distributions. Define correlations and market conditions for realistic modeling.
Tornado charts and tail driver analysis show which risks drive cost and schedule outcomes. Heat maps highlight where portfolio risk concentrates so the team knows where to focus.
Define risk response actions with residual probability and impact. Run Compare-Both mode to overlay pre/post CDF curves and see the ROI of every response dollar.
A modern, browser-based interface that's powerful yet intuitive. All data stays local on your machine.
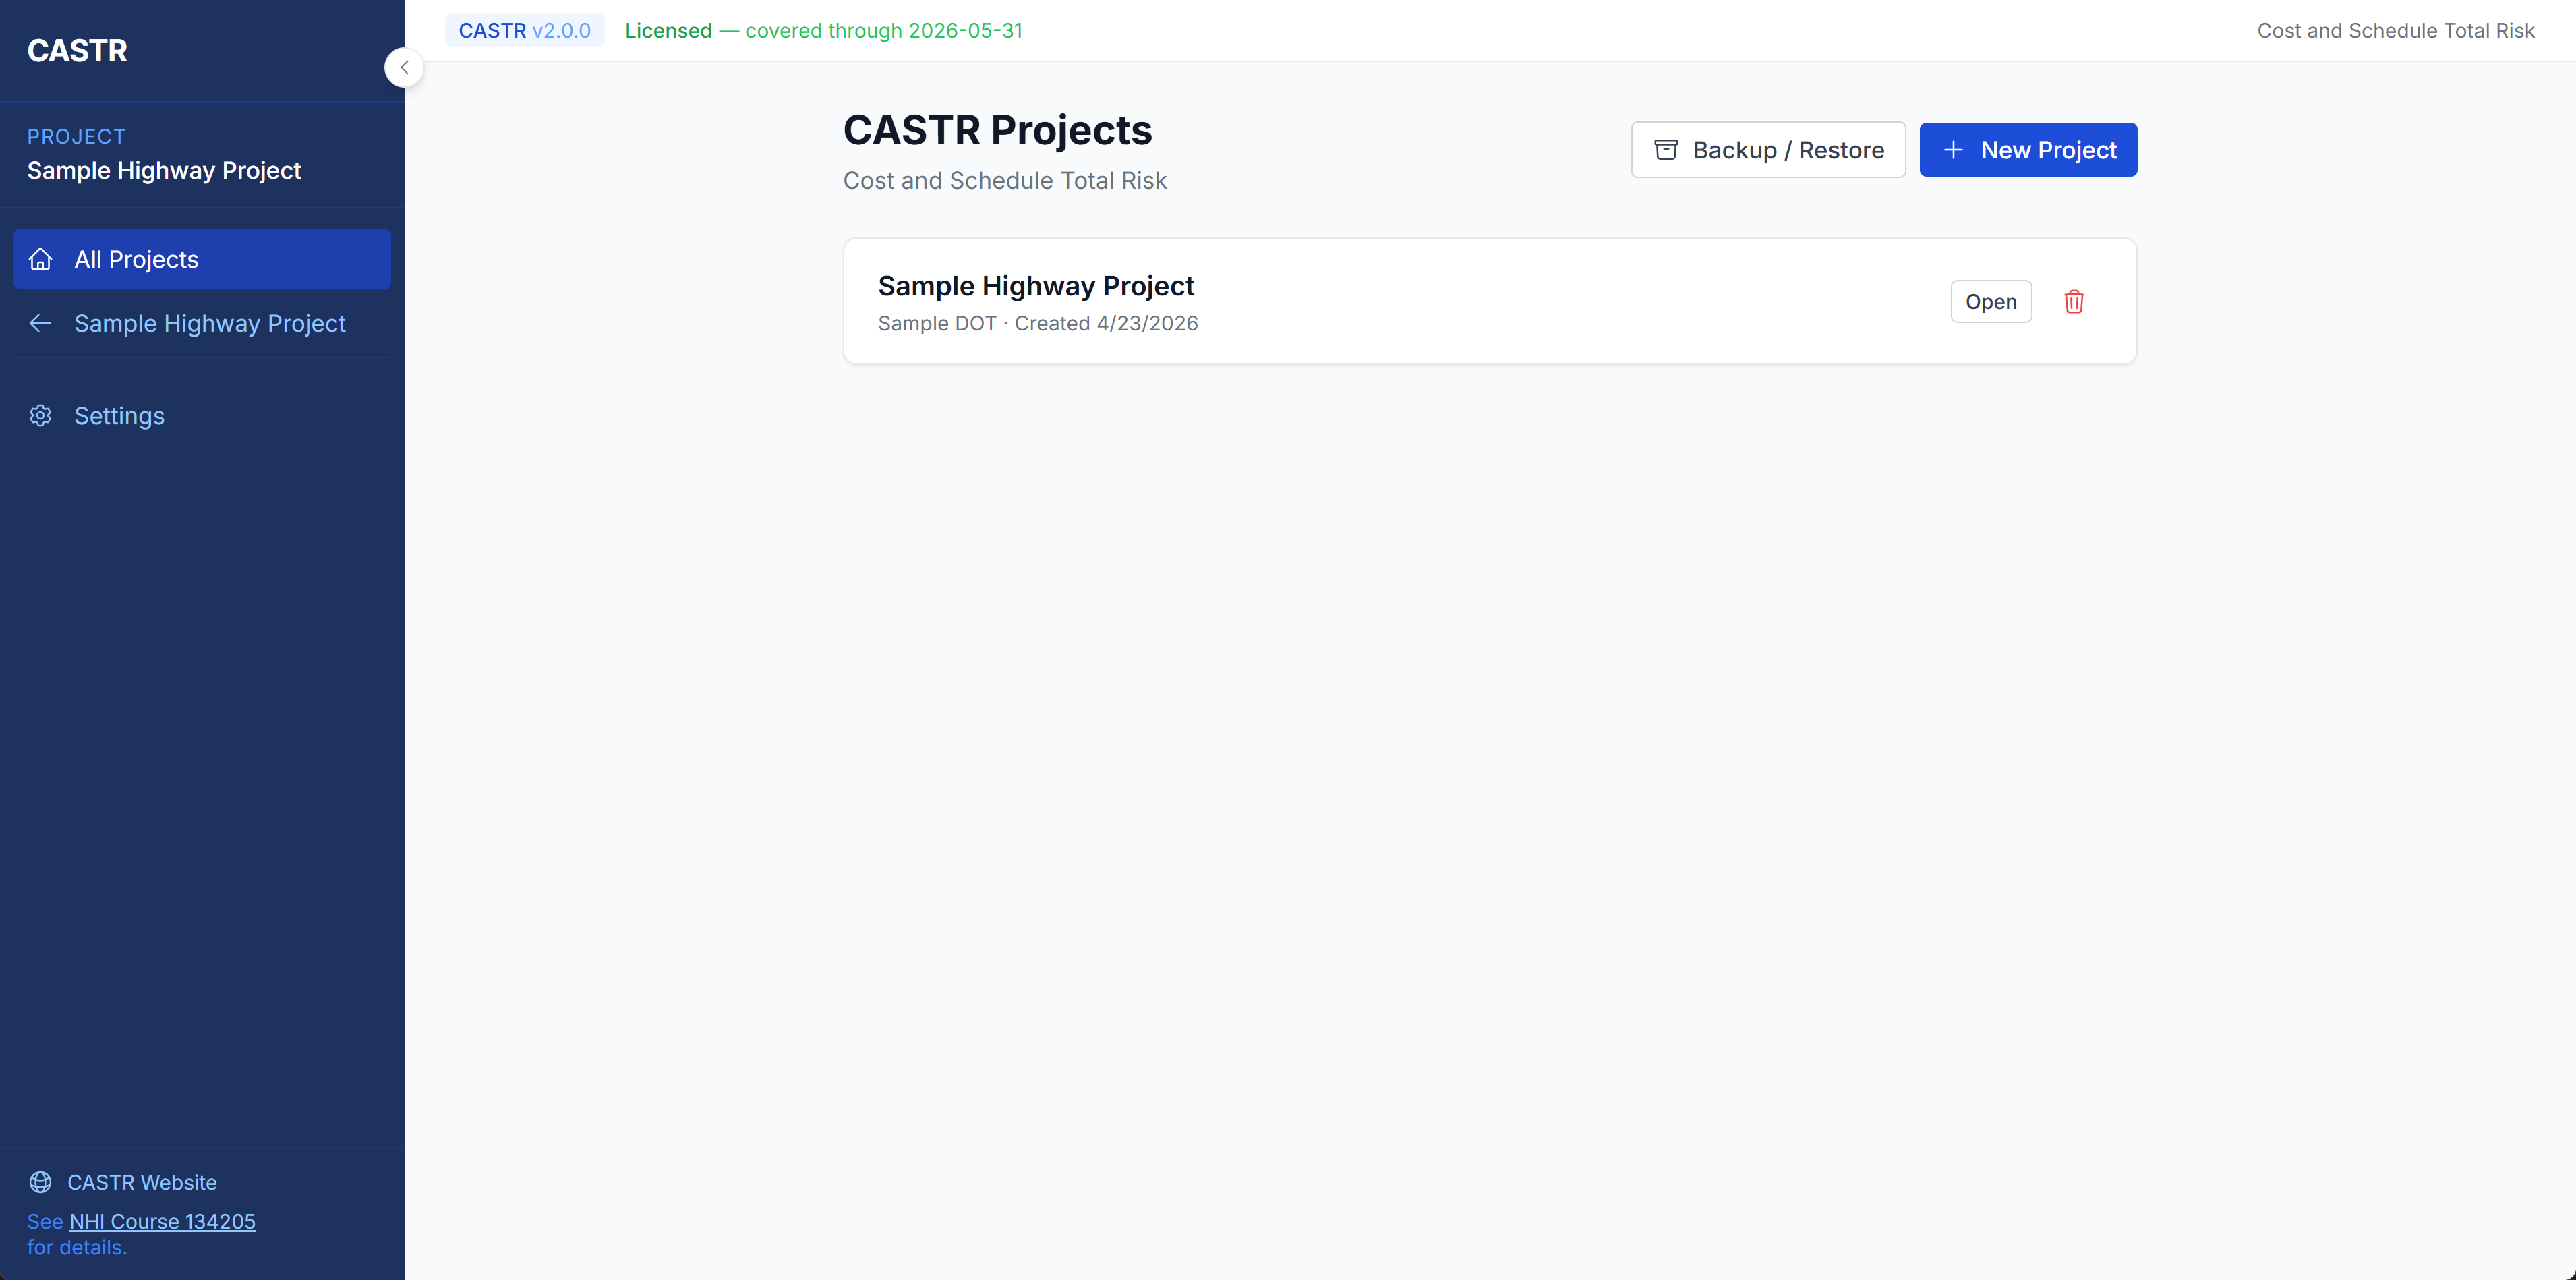
Organize multiple projects with an intuitive dashboard. Create, duplicate, and manage projects with full backup and restore capability.
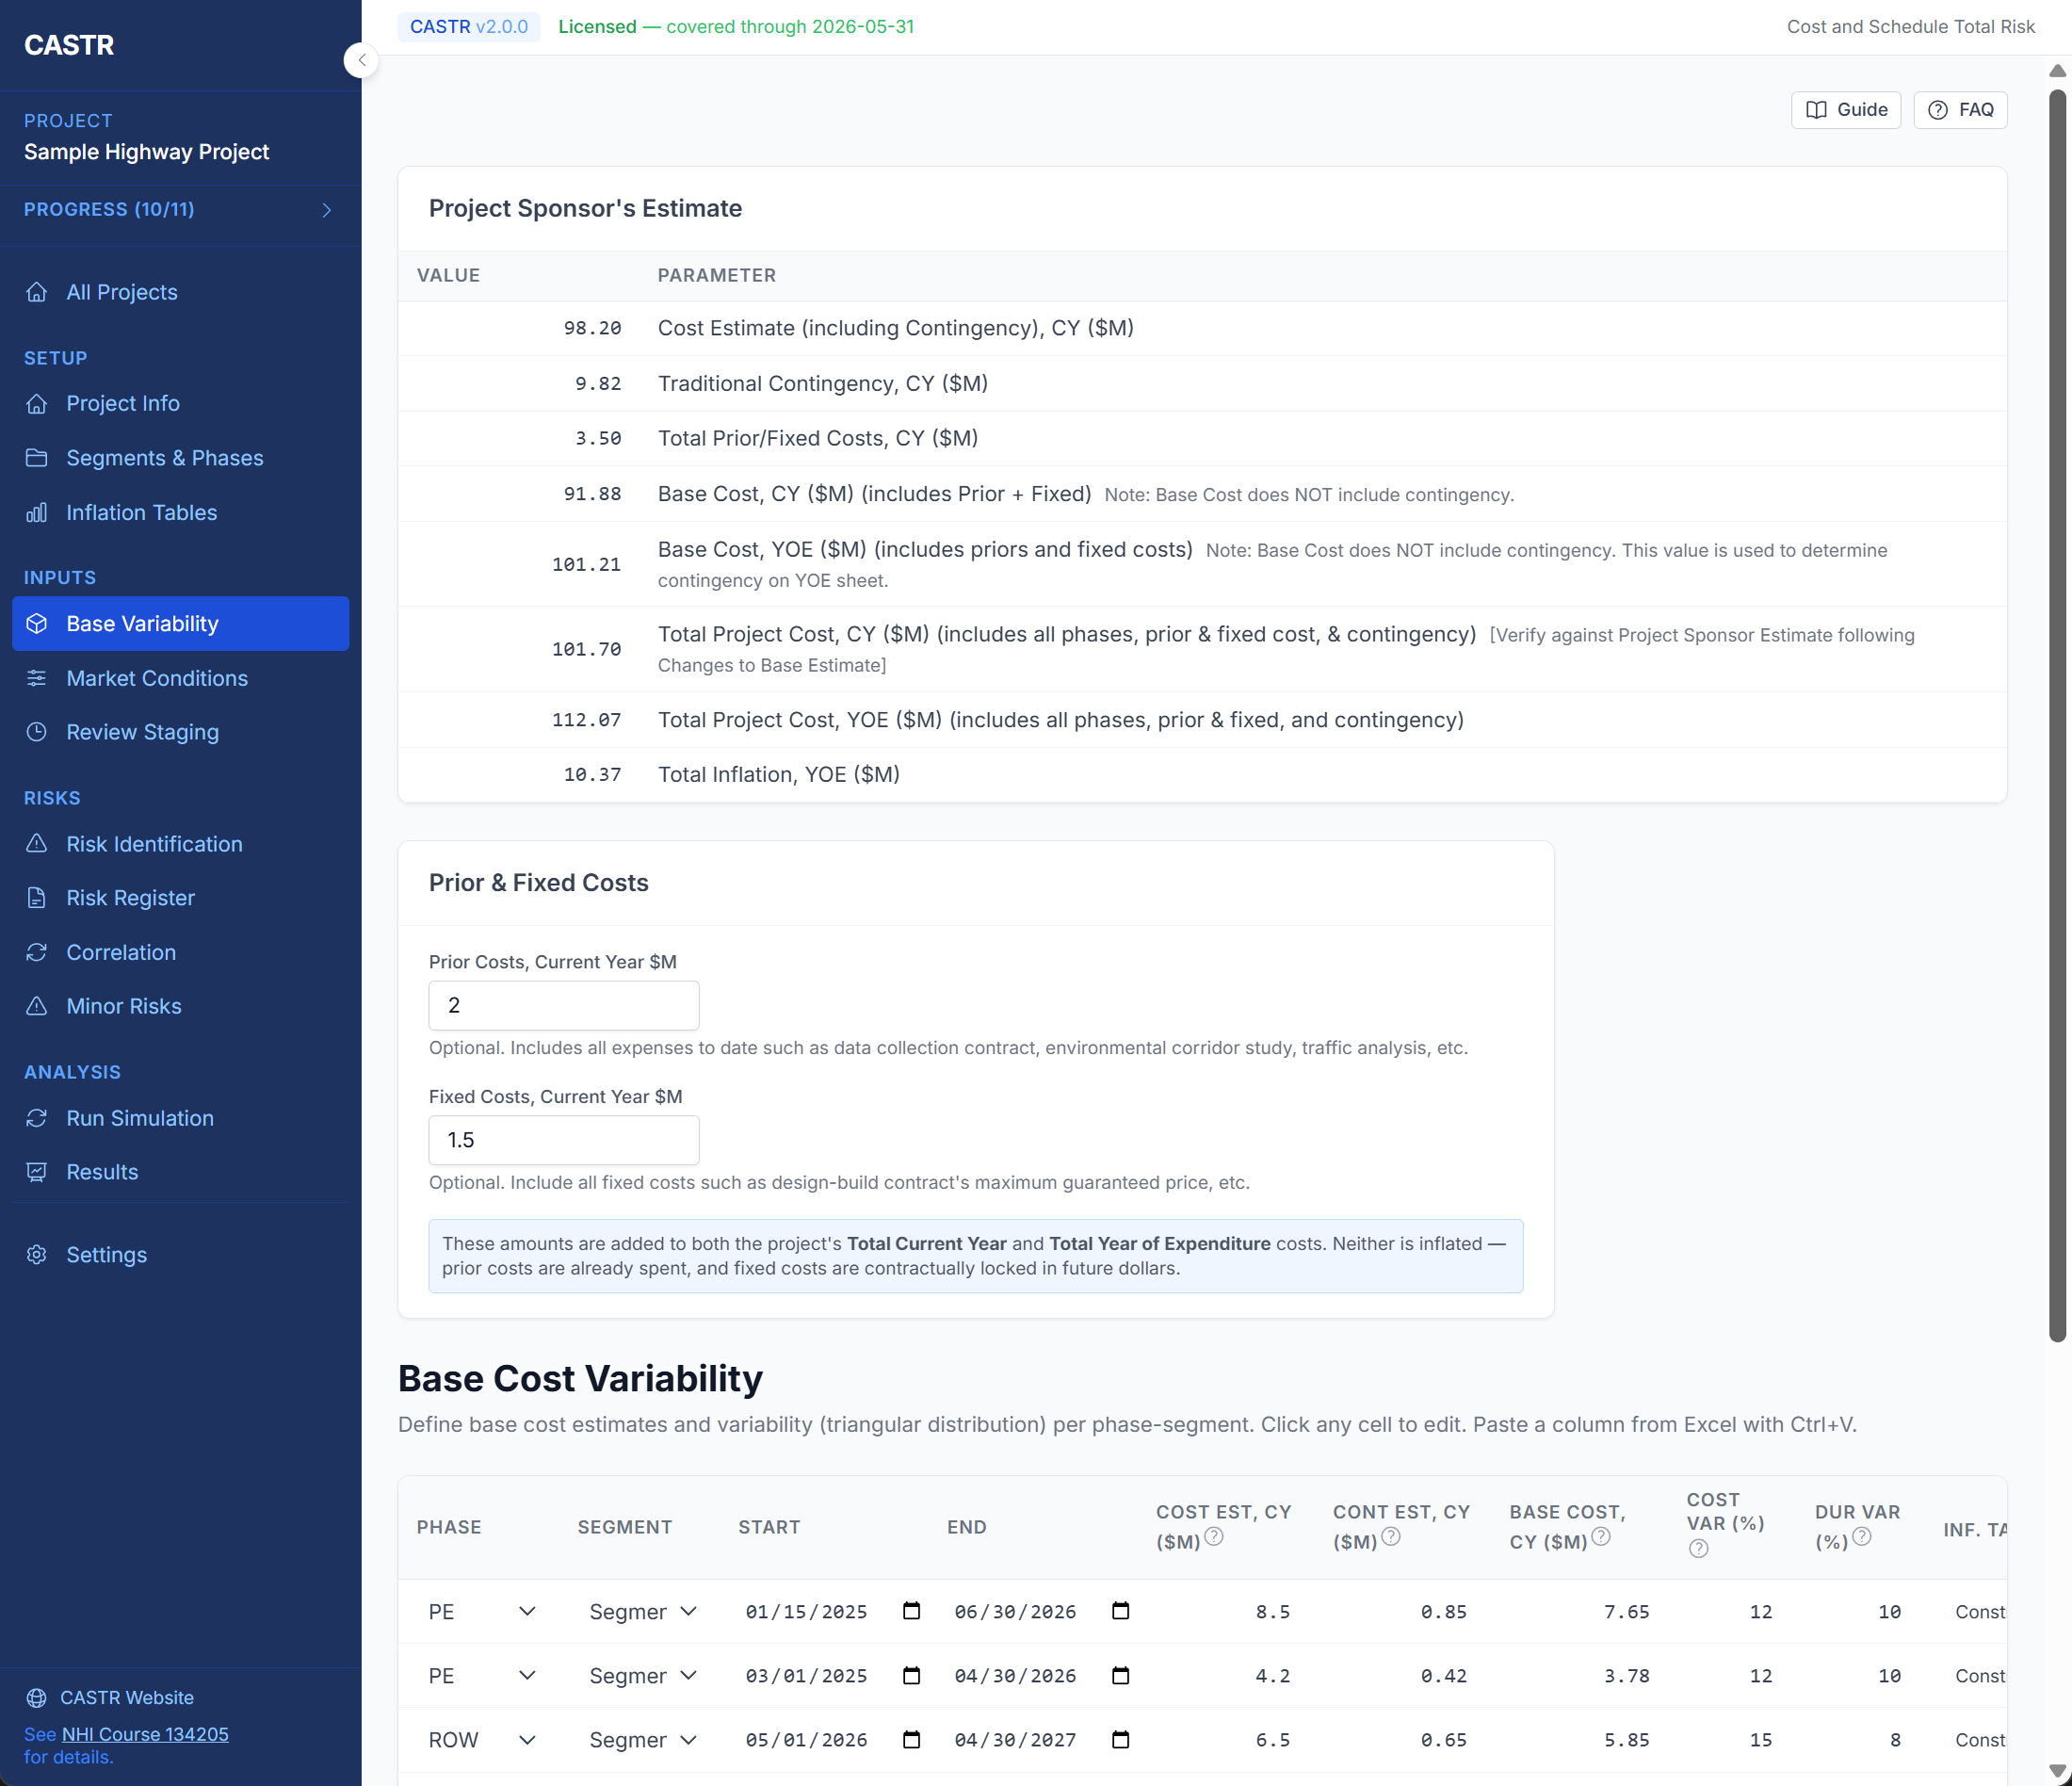
Enter your project cost and schedule estimates per phase-segment, define variability ranges, and assign inflation tables — CASTR calculates Base Cost CY, Base Cost YOE, and inflation amounts automatically.
Model Better-Than-Planned, As-Planned, and Worse-Than-Planned market scenarios per phase-segment. Built-in gap detection warns you when scenario ranges don't overlap, preventing probability dead zones in the simulation.
Define how phase-segments relate to each other with predecessor/successor linkages. Choose Direct or Delay-Dependent rules to control how schedule changes propagate through the project network.
Rapidly score risks in workshop sessions using a 1–5 probability/cost/schedule framework. Two 5×5 heat maps give an instant visual snapshot of where portfolio risk concentrates, so the team can focus discussion on the highest-priority items.
Define risk events with four distribution shapes, dependency types, and detailed documentation. Standard and Triage views on the same data for full edit or rapid 1–5 scoring workflows.
Know exactly how much of your risk portfolio has been vetted by the workshop. The Contingency Envelope cards track Seeded vs. SME-Reviewed risk counts so the team can see at a glance how much review work remains.
Fine-tune the Monte Carlo engine with configurable iteration counts (100–100,000), convergence tolerance, and random seed control. Three run modes let you analyze pre-response, post-response, or compare both side by side.
Get clear, defensible budget recommendations with NHI-134205 contingency breakout, inflation sensitivity scenarios, and component analysis.
Visualize simulation outcomes across four dimensions — Cost CY, Cost YOE, Completion Date, and Duration — with interactive histogram and CDF overlay charts.
See the full picture of project risk with a joint cost-vs-schedule scatter cloud. Understand how cost and schedule outcomes interact, and find the confidence level where both targets are met simultaneously.
Go beyond risk identification. Define per-axis risk response strategies for each risk, model the residual probability and impact, then run pre- vs. post-response simulations to see exactly how much your response program is worth.
Pinpoint exactly which risks matter most with tornado charts and tail driver analysis, so teams can focus risk responses where they count.
Deactivate one or more risks and instantly re-run the simulation to see exactly how the YOE distribution and contingency shift. Understand each risk's true dollar contribution to the budget recommendation.
CASTR is free. The download runs as a 90-day trial with a sample project plus 2 additional projects; request your free perpetual license to unlock unlimited projects. Your license never expires — the app keeps working forever. The only paid item is optional upgrade coverage after your first 12 months.
Perpetual use of any CASTR build released in your first 12 months. The app keeps working forever on versions you're entitled to.
The download runs as a 90-day trial (1 sample project + 2 additional projects) until you activate your free license. Unlimited projects once licensed.
Already licensed? Extend your upgrade coverage another 12 months. Renew while you're still covered and the 12 months are added to your existing end date; renew after expiry and they start the day you renew. Either way, you never pay for time you don't get.
Your Machine ID is visible in the top bar of the app once it is licensed.
Everything you need to know about CASTR licensing.
A perpetual license to any CASTR build released within the 12 months after activation, at no cost. The app you install never stops working — there's no subscription, no phone-home, no auto-renew.
Your installed CASTR keeps working forever. If we release a newer version and you want it, renew upgrade coverage ($49.99) to get another 12-month upgrade window. If you don't care about new versions, do nothing — your current build is yours.
Only access to newer releases. No features get disabled, no projects become inaccessible.
Licenses are bound to a Machine ID. Email support and we'll reissue at no charge.
The key unlocks unlimited projects and is tied to your Machine ID. Request it on the license page — no payment information is required.
No. Upgrade-coverage renewals are optional and manual. You control when (or whether) to extend.
No. Customers who purchased before the upgrade-window model was introduced keep lifetime access to all future versions — no renewal needed, ever.
CASTR was developed by a retired FHWA specialist with 32 years of experience in cost and schedule risk assessment, including direct involvement in developing the federal CSRA model. Every analytical feature has been verified against established methods.
CASTR implements the NHI Course 134205 probabilistic risk-based estimating framework. Monte Carlo simulation outputs, contingency calculations, and distribution fitting have been cross-validated against the original FHWA Excel template to confirm numerical agreement. The User Manual documents the mathematical basis for every calculation so results can be independently reproduced.
Every feature, formula, and analytical workflow was specified, reviewed, and validated by the developer based on decades of hands-on experience teaching and applying the PRBE framework across state DOTs. AI-assisted development accelerated the engineering process; the domain expertise and quality standards behind every decision are human.
CASTR ships with a comprehensive User Manual that explains the methodology, assumptions, and calculations behind every result. Simulation settings are fully configurable, seed control enables reproducible runs, and all results can be exported for independent review. The Diagnostics Report provides a complete audit trail of project configuration and run parameters.
CASTR runs locally on your machine — no project data is transmitted to external servers. The application is distributed through GitHub Releases with versioned builds. All code is original to CASTR with no third-party open-source library dependencies that would introduce licensing or supply-chain concerns.
CASTR is under active development with regular releases adding new analytical capabilities. Version history is maintained on GitHub, and the User Manual is updated with each release to document new features and any changes to existing calculations. User feedback from state DOT practitioners and consultants directly informs the development roadmap.
CASTR was created by Michael Smith following his retirement from the Federal Highway Administration in 2023, where he spent 32 years advancing quantitative risk assessment for highway infrastructure projects.
The application implements the methodology taught in the National Highway Institute (NHI) Course 134205, making rigorous probabilistic cost and schedule estimating accessible to project teams without requiring specialized statistical software.
CASTR is a standalone desktop application that runs entirely on your local machine. It launches a local server and opens in your web browser, requiring no cloud connectivity or external dependencies. All project data remains on your computer, ensuring complete data privacy and security.
Compatible with Microsoft Windows. Chrome, Edge, or Firefox recommended for the best experience.